

From practice: MELARECON as an intelligent I/O device
Hello and welcome to the second part of the “From Practice” series. Today I would like to show you how to visualize the states of the MELARECON IO from the small sample project in the previous post “MELARECON as an I/O device” on SolidBlue. Basically, this example can also be implemented with any MELARECON.
Small remodel
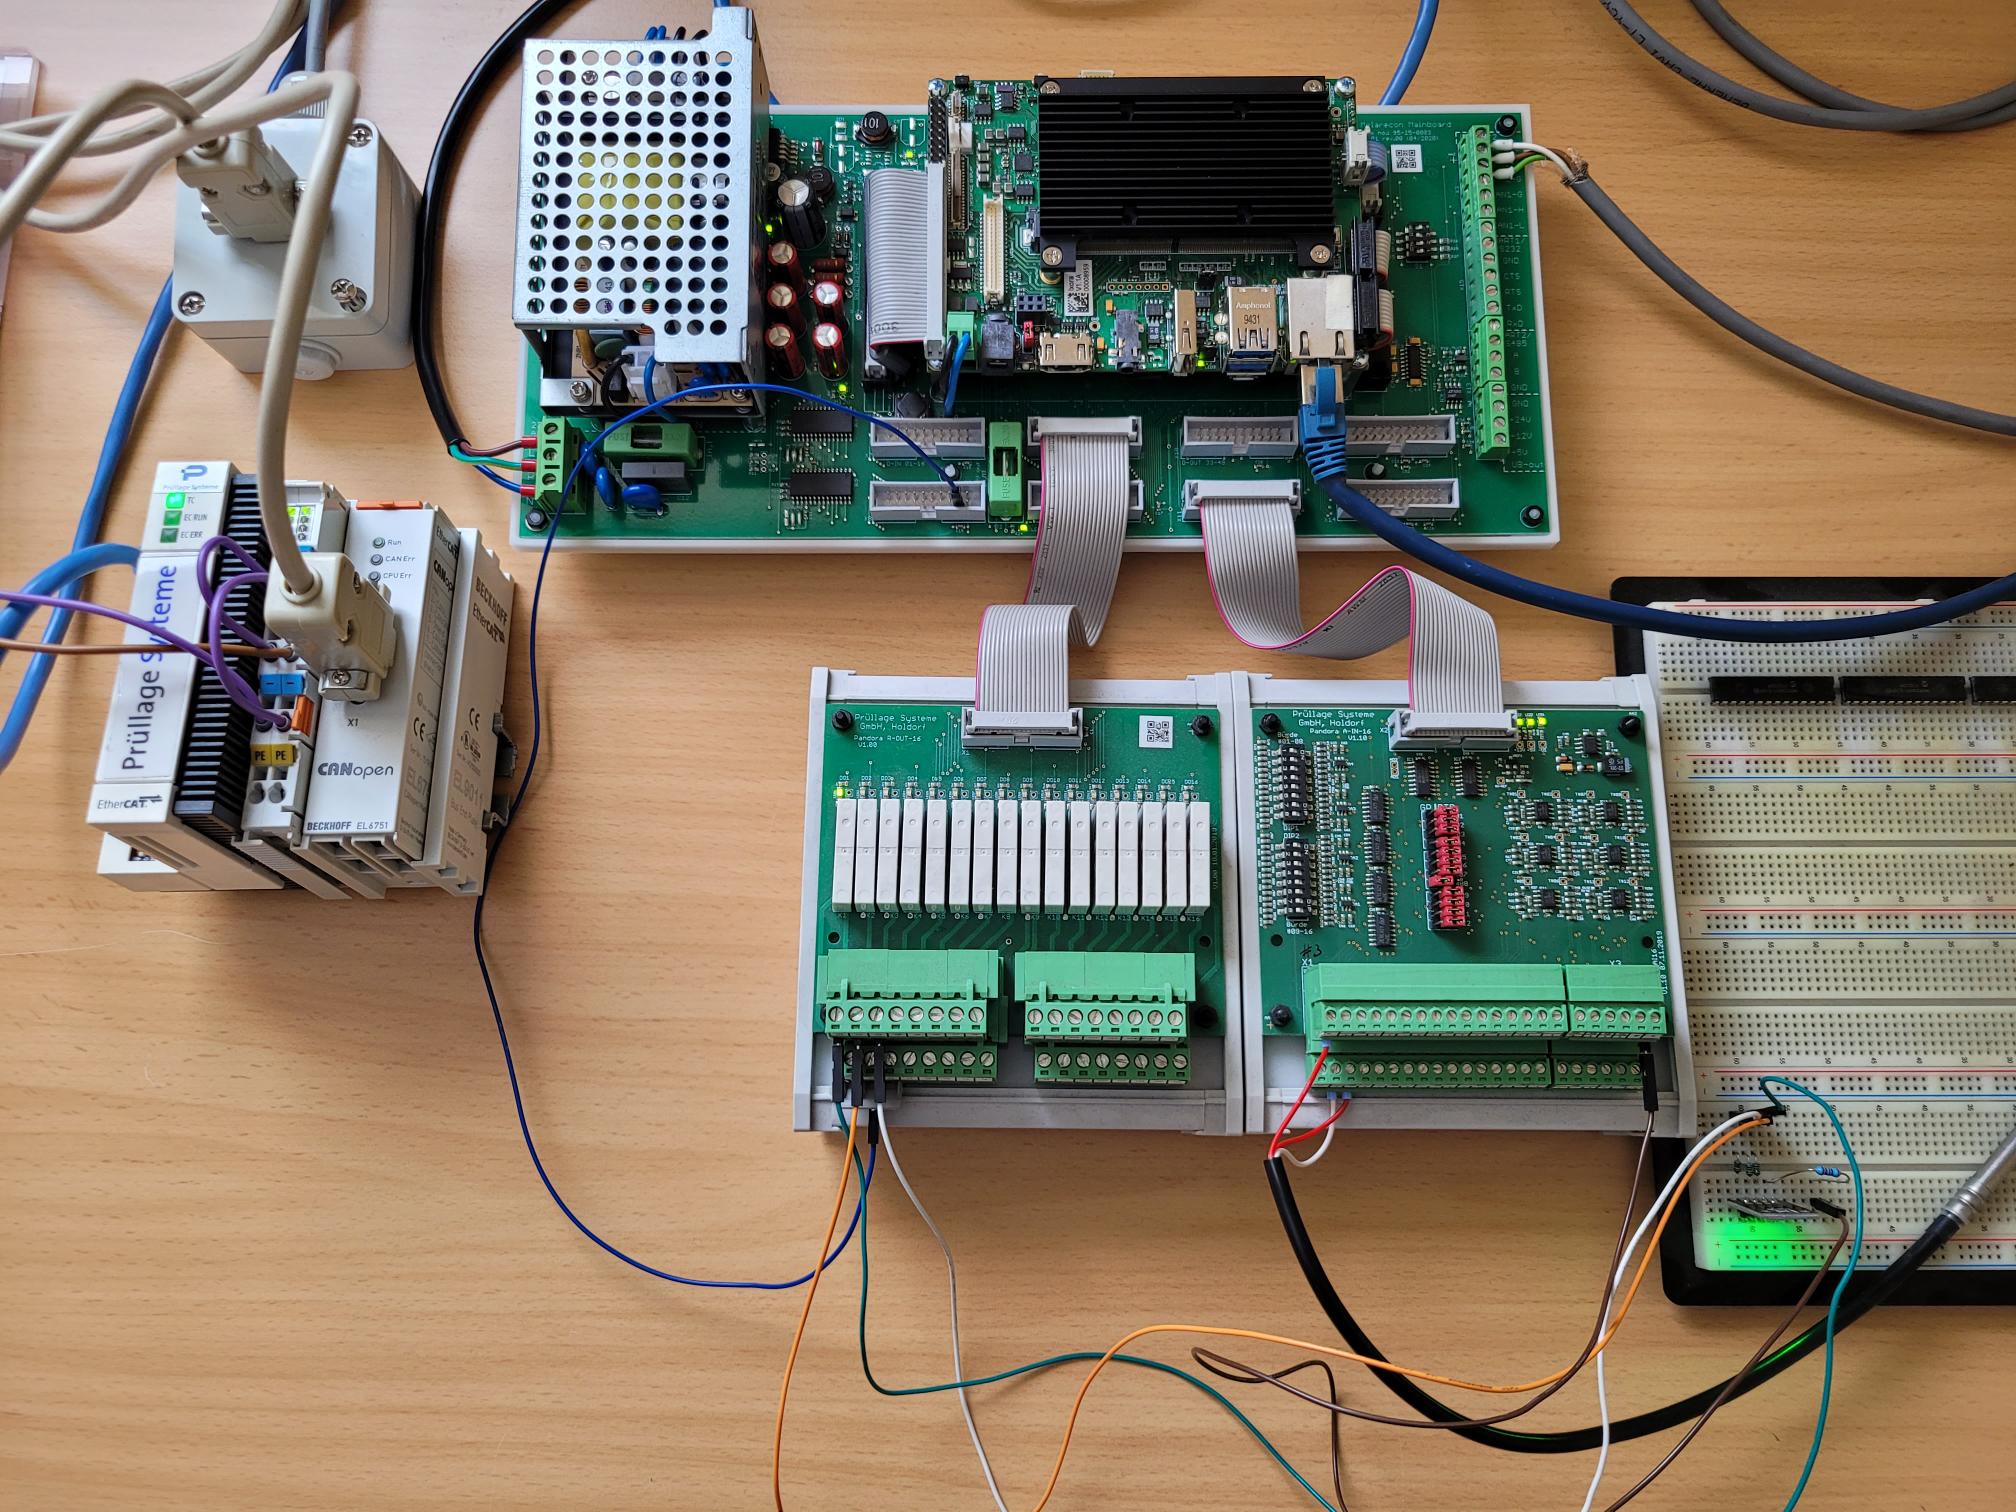
I disconnected the potentiometer on my test setup and connected a temperature sensor instead. I decided to do this simply to get even closer to practice. For this conversion I made the following changes:
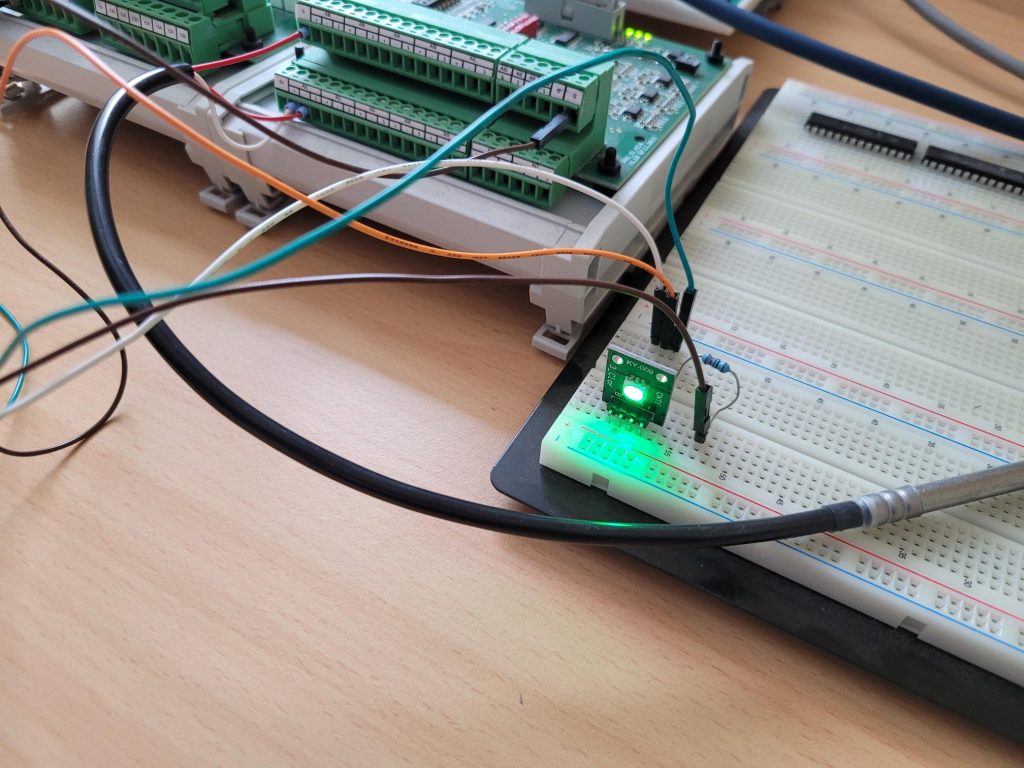
- Replacing the potentiometer with a PT1000 temperature sensor. Don’t forget to set the jumper on the analog input card to the RTD position.
- In the TwinCAT System Manager I changed the setting of the index 0x4200; subindex 3 to value 4 in the SDOs tab of the node. As a result, the MELARECON IO no longer sends the value as a 0..10V signal but as a temperature value.
- In the PLC program, I changed the limits for controlling the blue LED to 19.5 °C and for the red LED to 22.5 °C.
Trend recording
We now have a temperature sensor, which shows me via an LED whether the temperature is too cold, too warm or okay. In the next step, I would like to have the MELARECON record a temperature curve. Which measured values are to be recorded can be determined via a CSV interface. You can download the already prepared CSV file from the MELARECON using a FTP client. The file is located in the “/FlashDisk/Melarecon” folder and is named “SettingsMeasurement.csv”. If you open the file e.g. with Excel, you will already be shown a ready-made list of the measured values.
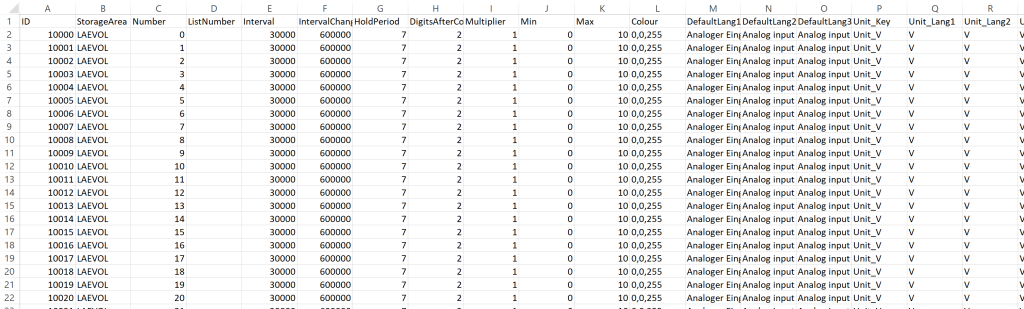
In the delivery state, all analogue inputs are therefore recorded as a 0..10V signal. You can now simply expand the list or delete all entries and only enter your desired measured values. For a better overview, I choose the second variant and delete all lines except for the header and enter the following settings in the second line:
- ID: An ID must always be greater than 10000. I choose ID 10100.
- StorageArea: Here you determine the storage area from which the measured value to be read is to be taken. I choose here LAEPT1000 for local analog input as temperature sensor value.
- Number: Each memory area is basically structured like a list in which several values are located one below the other. I would like to record the third analog value and therefore choose index 2. The index of a memory area list always starts with 0.
- ListNumber: There are memory areas that are divided into further lists. We don’t need this setting here and I leave this entry blank.
- Interval: Here you can specify the interval at which the values should be queried. The specification is in milliseconds. I select 30000 here for 30 seconds.
- IntervalChanges: This setting makes it possible to save storage space. If the measured value has not changed since the last query, the value will not be saved again. The time set here can be used to determine the interval after which the value should still be saved, even though there was no change. I choose 900000 for 15 minutes for this setting.
- HoldPeriod: Here you can specify how many days a measured value should be stored directly on the MELARECON. Measurements that are older are automatically removed.
- DigitsAfterComma: Here I set a 1. This means that the measured value is rounded to one decimal place. It is then decided whether there has been a change in value.
- Multiplier: You can multiply the readed value with the value set here, e.g. to carry out a conversion. I put a 1 here.
- Min / Max: These settings are for display only. This makes it possible to configure corresponding charts. I choose 10°C for the setting Min and 30°C for Max.
- Colour: A color value can be specified here as RGB. The individual color values must be separated from one another with a comma. Choose any color here.
- DefaultLang1 to DefaultLang3: Here you can set the name for the measured value. However, this can also be changed later at any time.
- Unit_Key and Unit_Lang1 to Unit_Lang3: The unit to be displayed can also be preset here.
- Group_Key and Group_Lang1 to Group_Lang3: It is possible to subdivide the measured values on SolidBlue into different groups.

Using the FTP client, I now overwrite the file already on the MELARECON with my customized file and restart the device. If you look at the MELARECON using VNC, the following is displayed under “Management / Trending”.
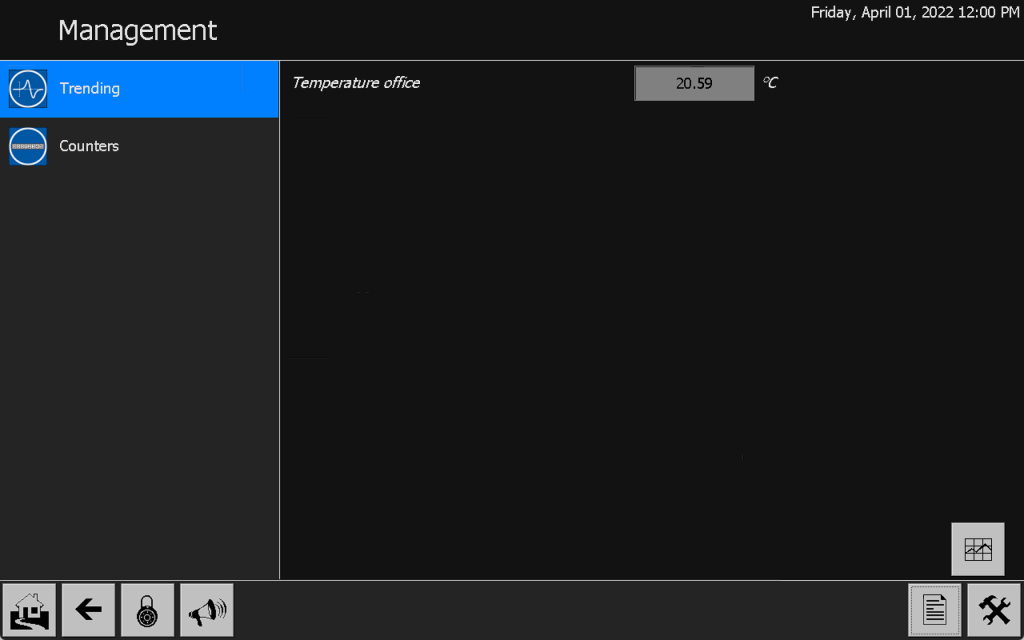
A trend of the new measured value can be displayed directly using the button on the bottom right.
Connection to SolidBlue
My colleague has already created an article in which he describes how a MELARECON can be connected to SolidBlue. If this interests you, please follow this link: MELARECON: First steps to the cloud
If I now go to the SolidBlue portal, many functionalities are already displayed to me. I would like to present a few of these possibilities in this series of pictures:
Prepared visualization for online access
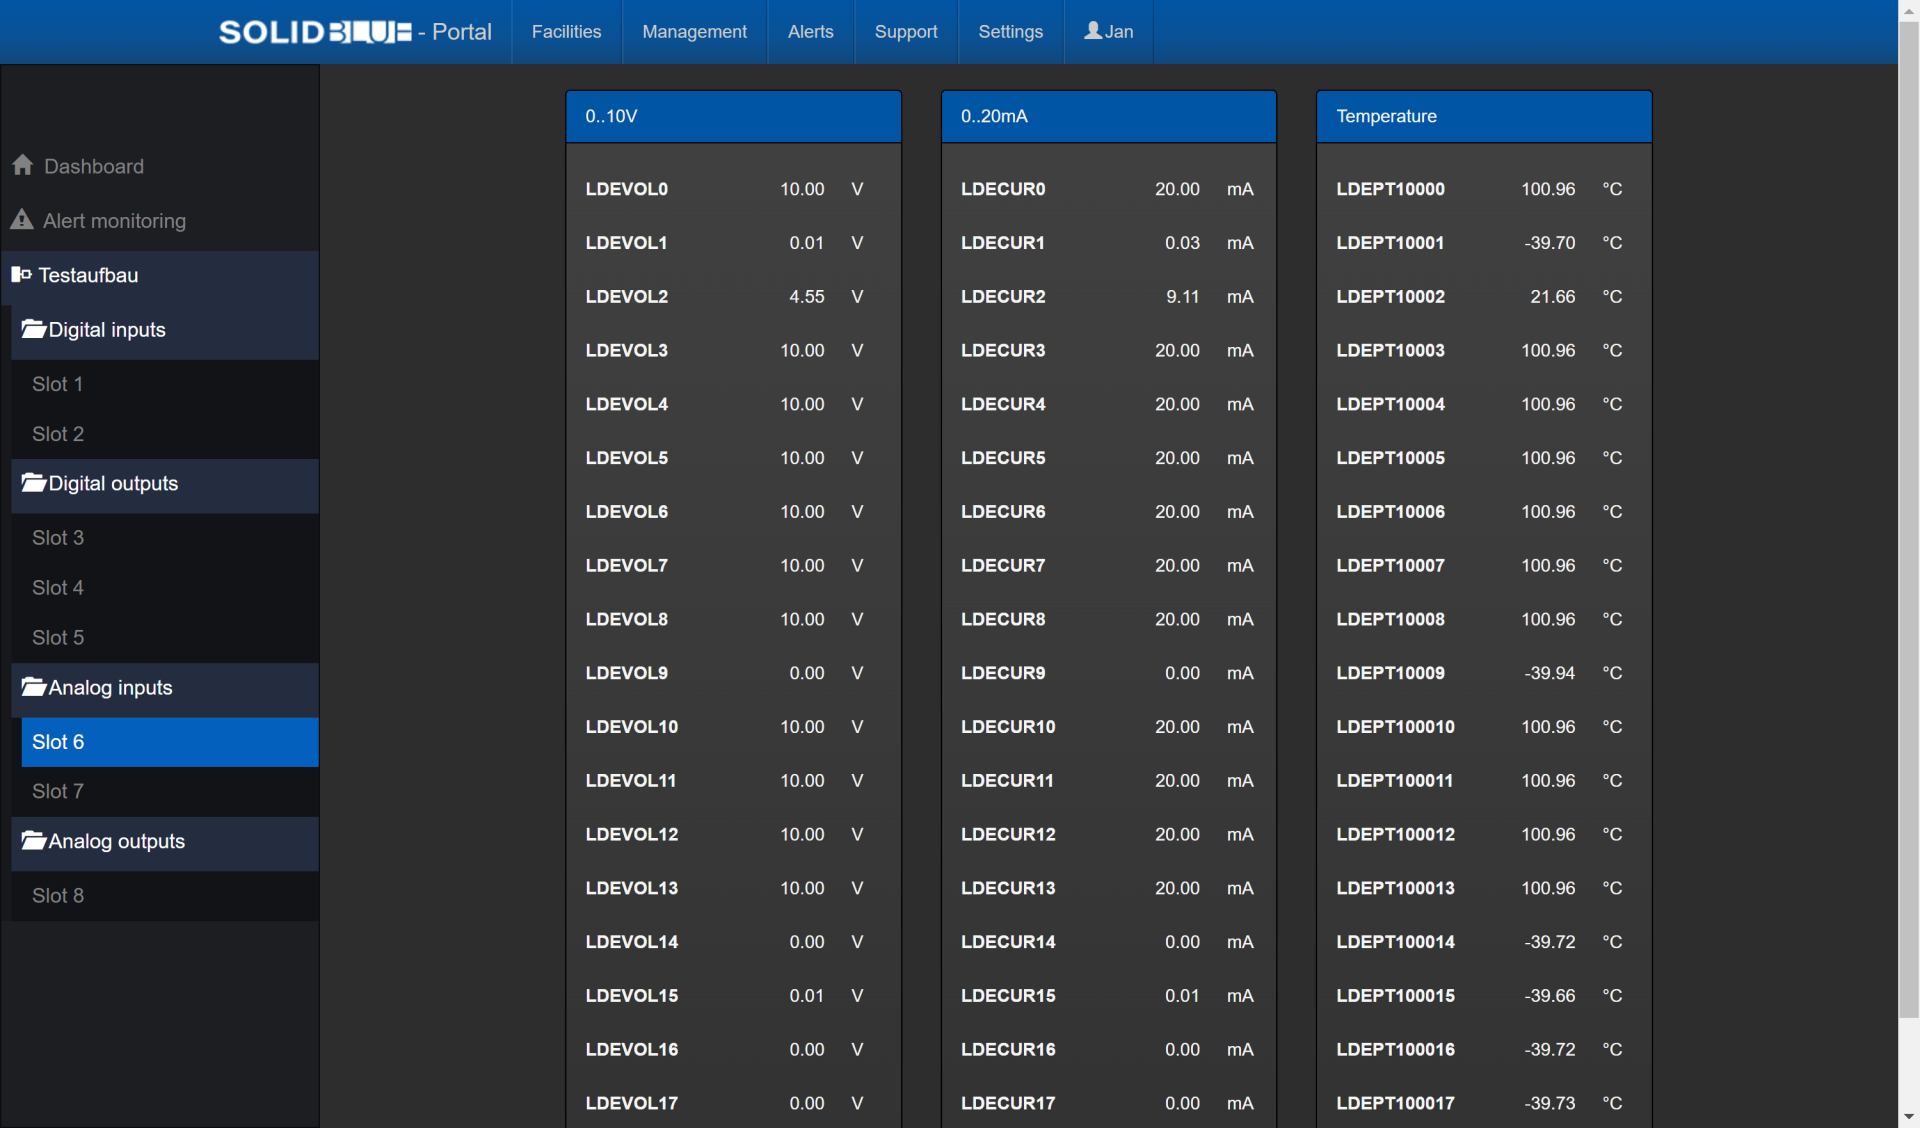
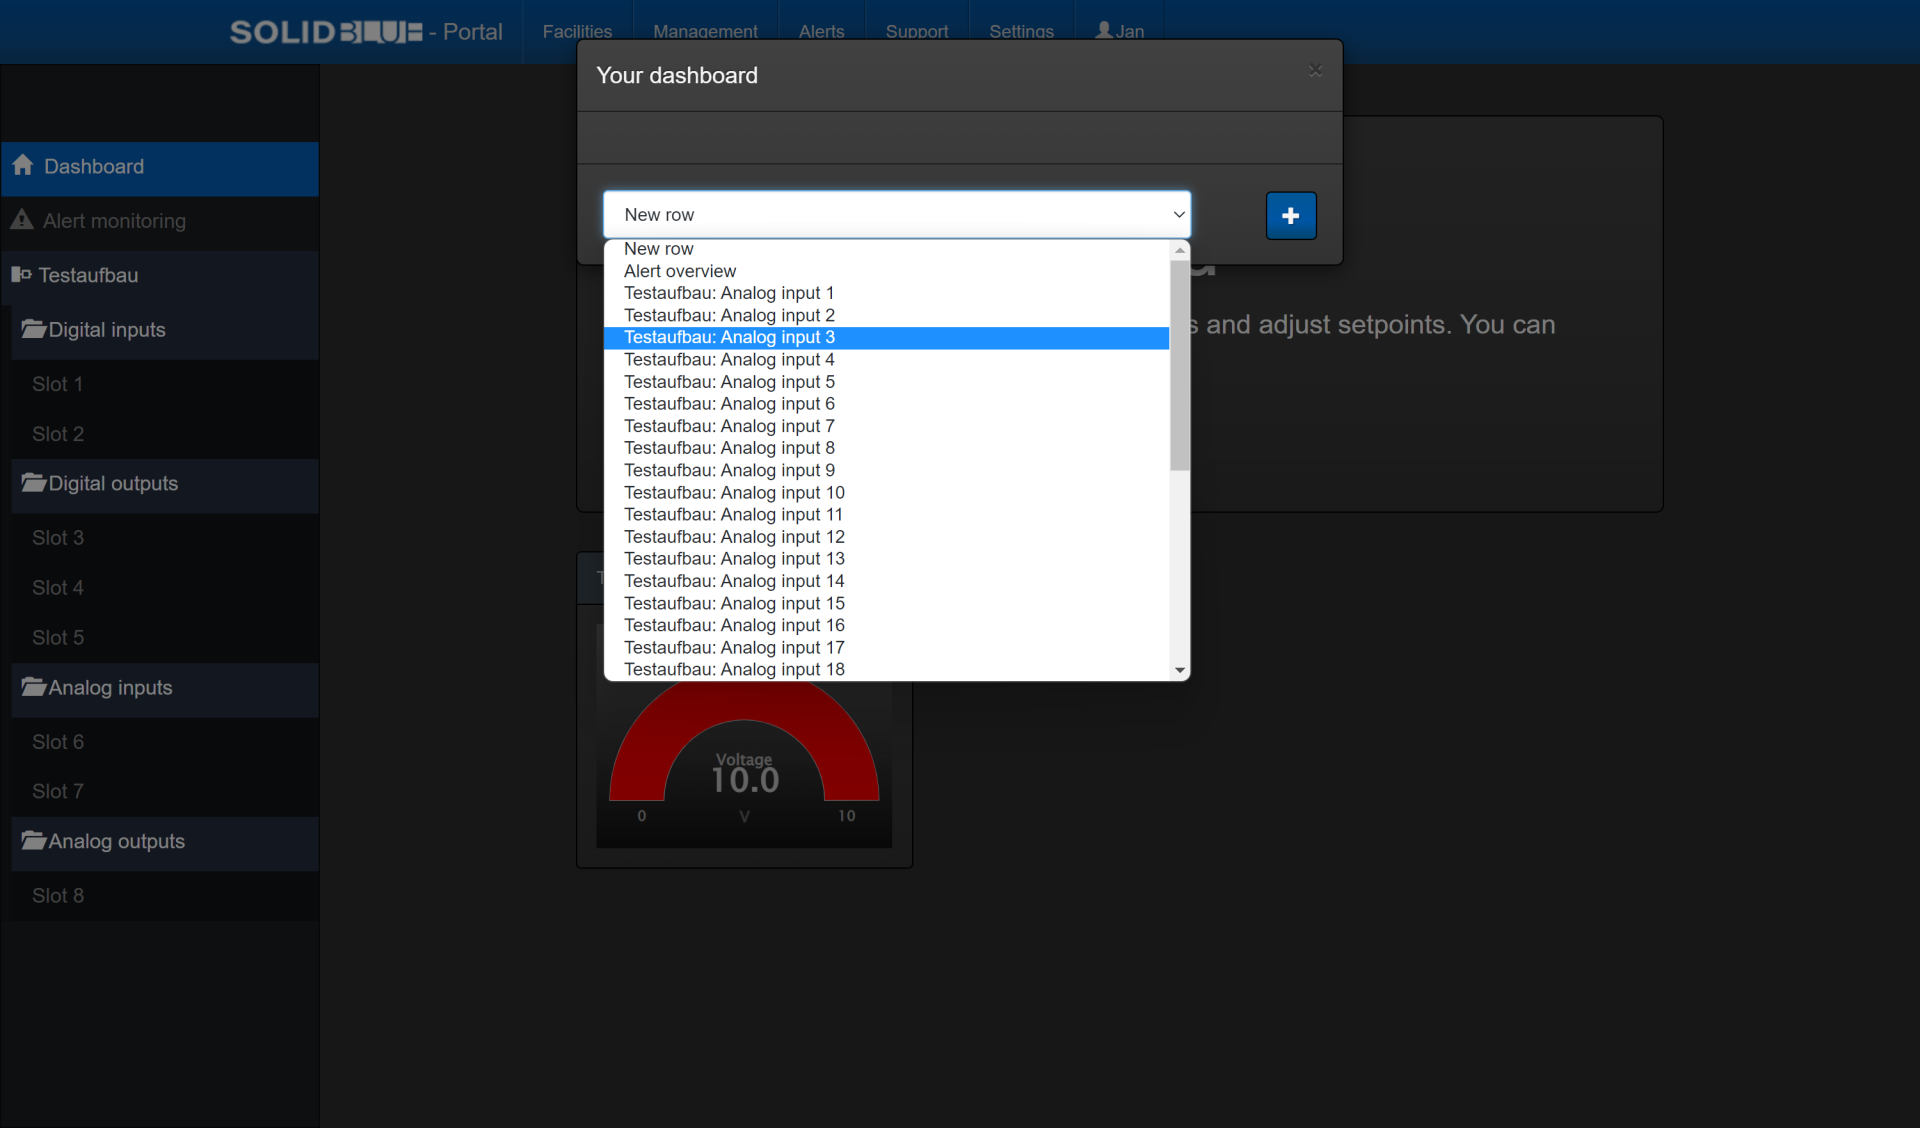
Display of each analogue input in the dashboard
Direct remote access to the device
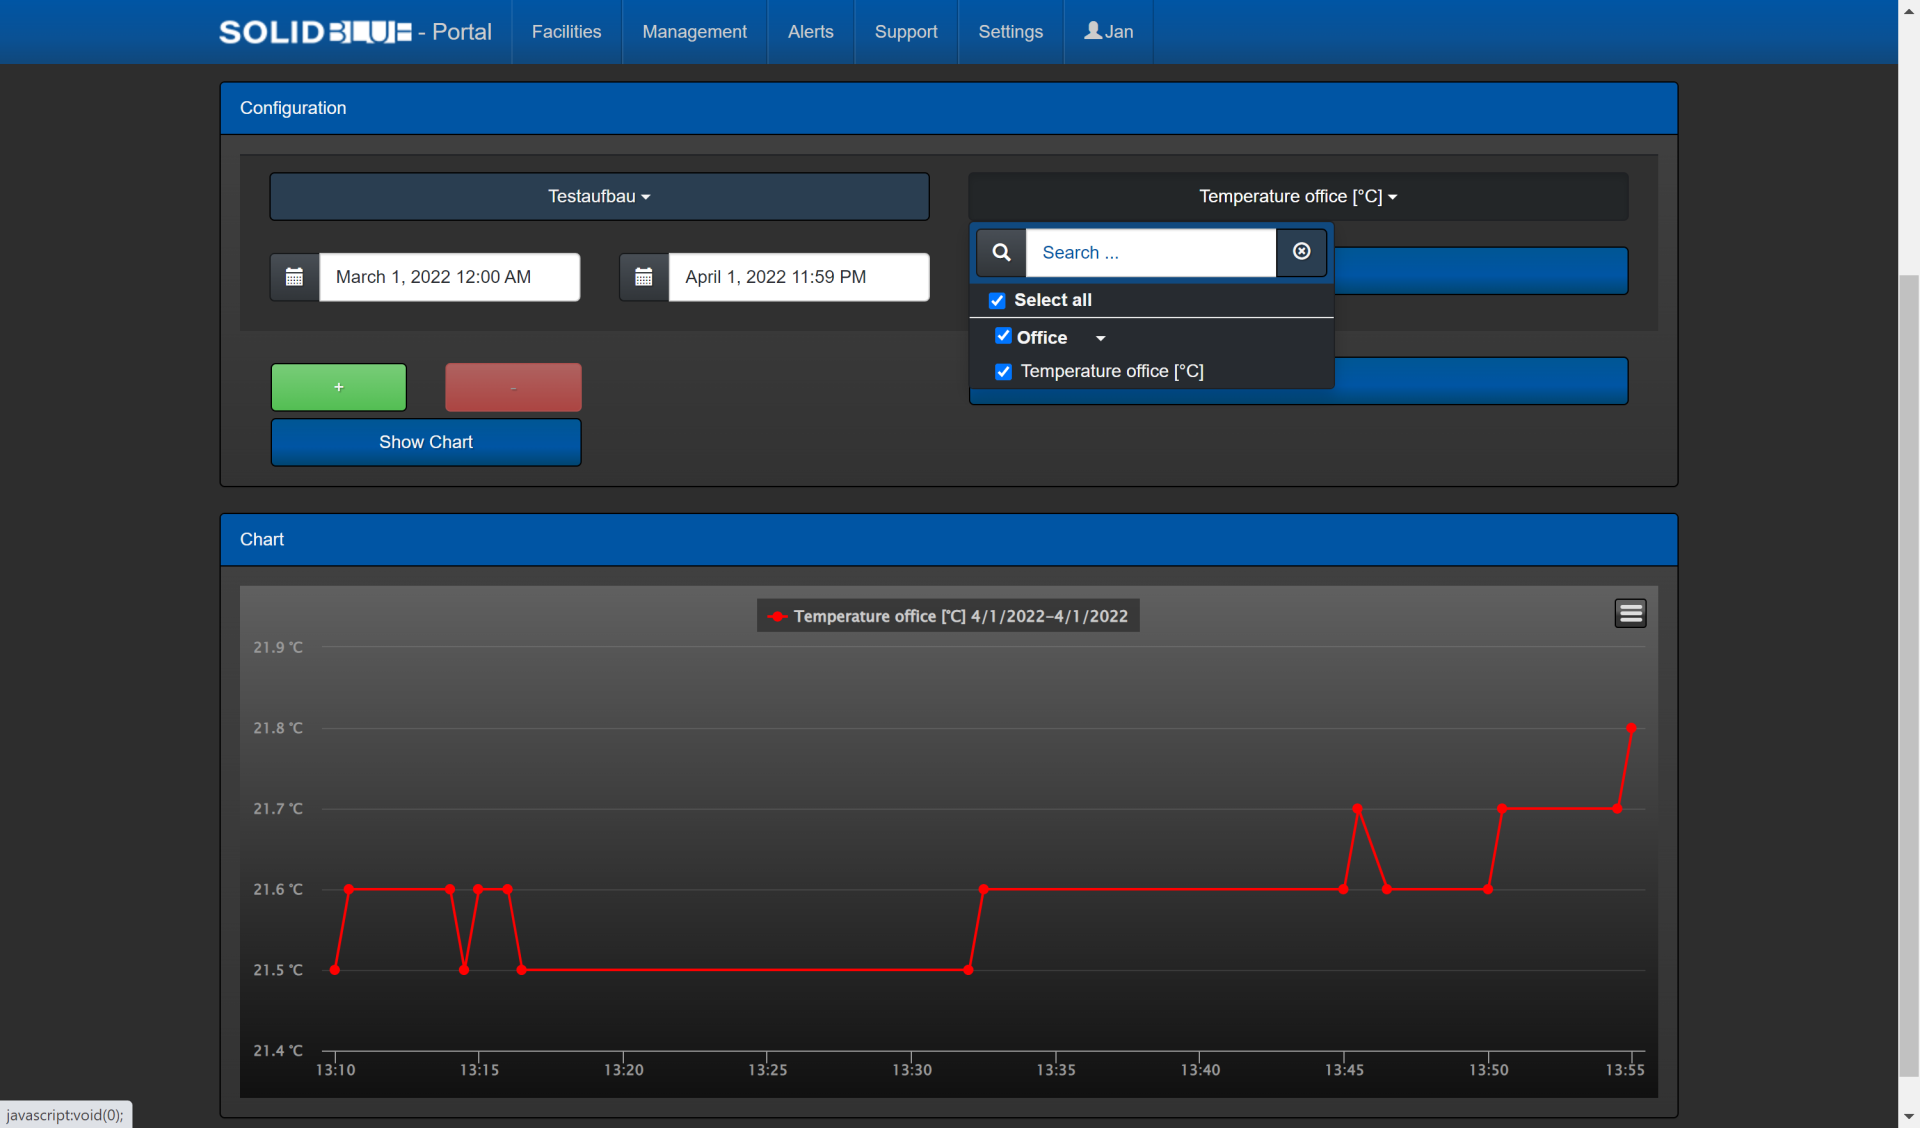
Trend evaluation
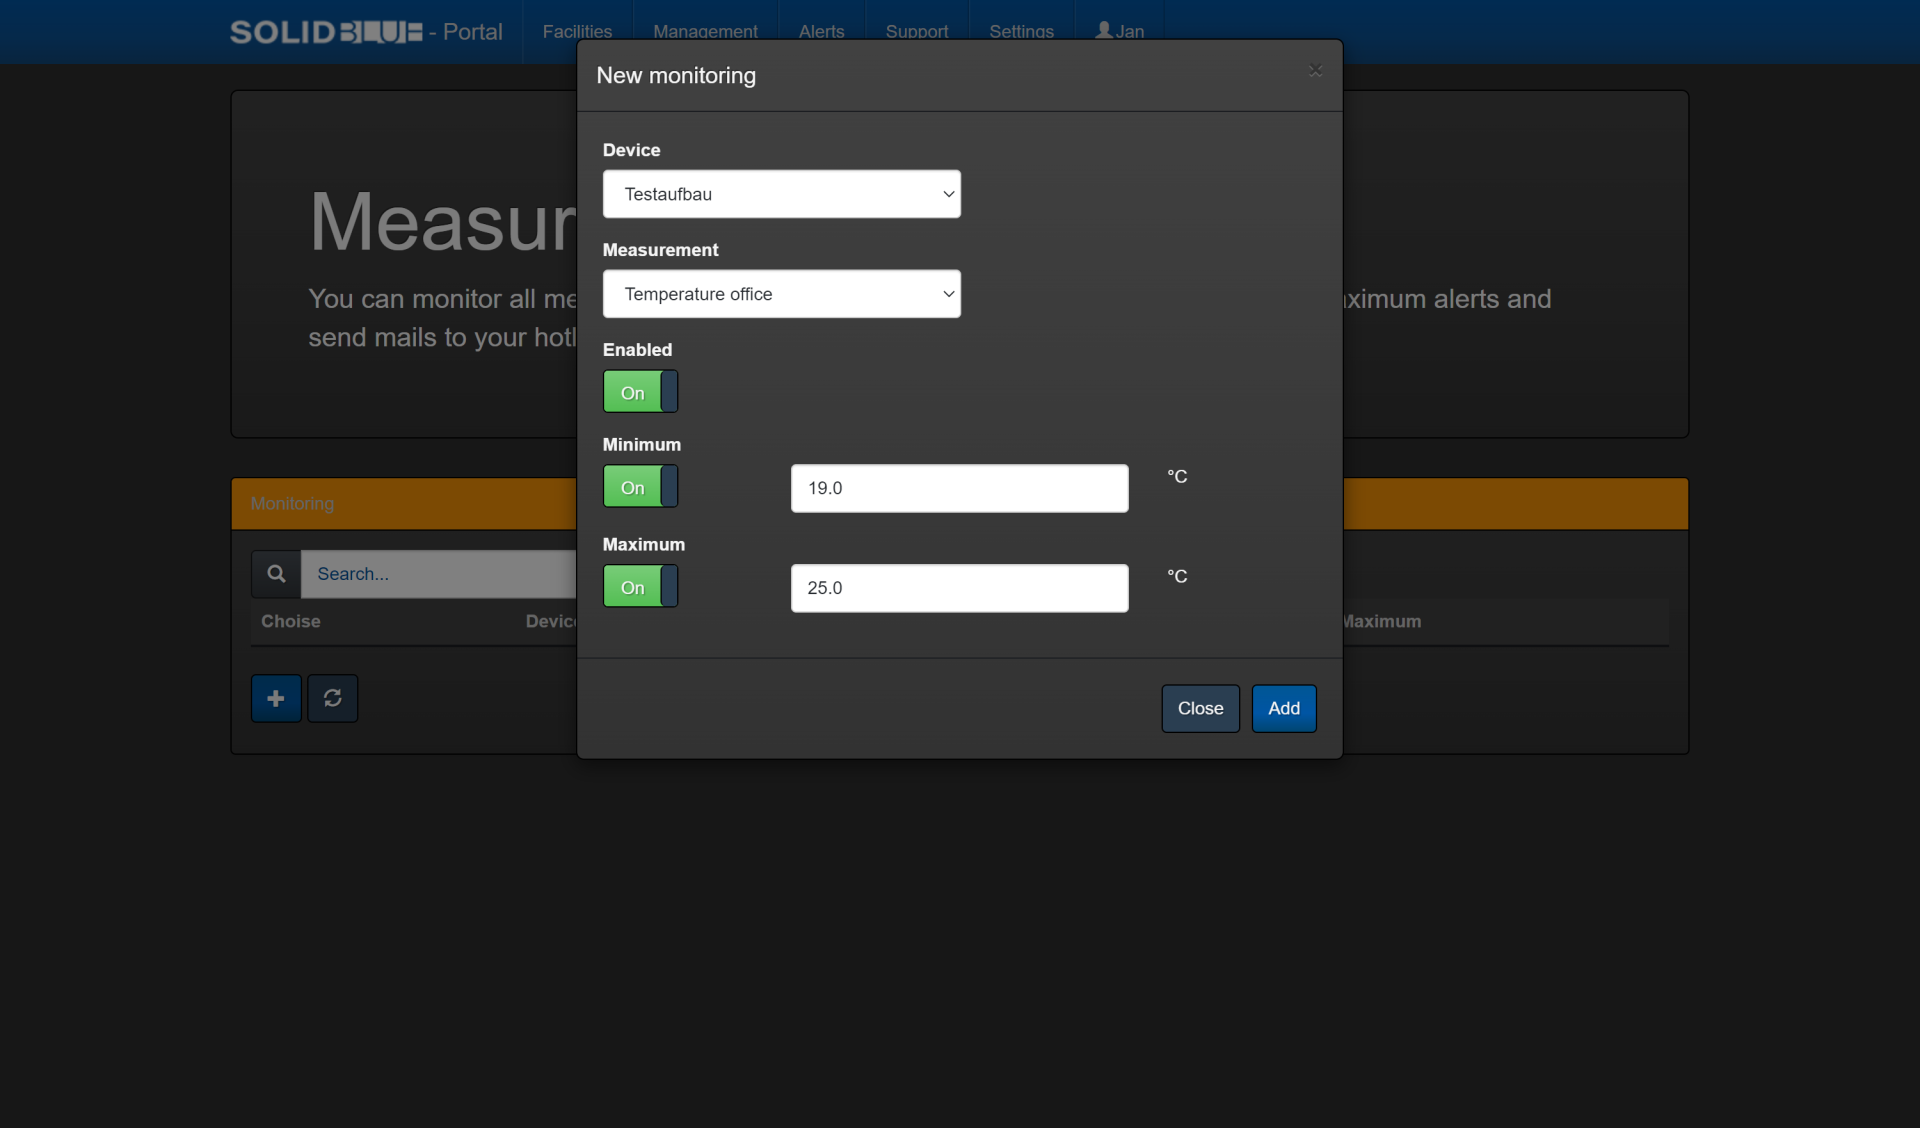
Measured value monitoring
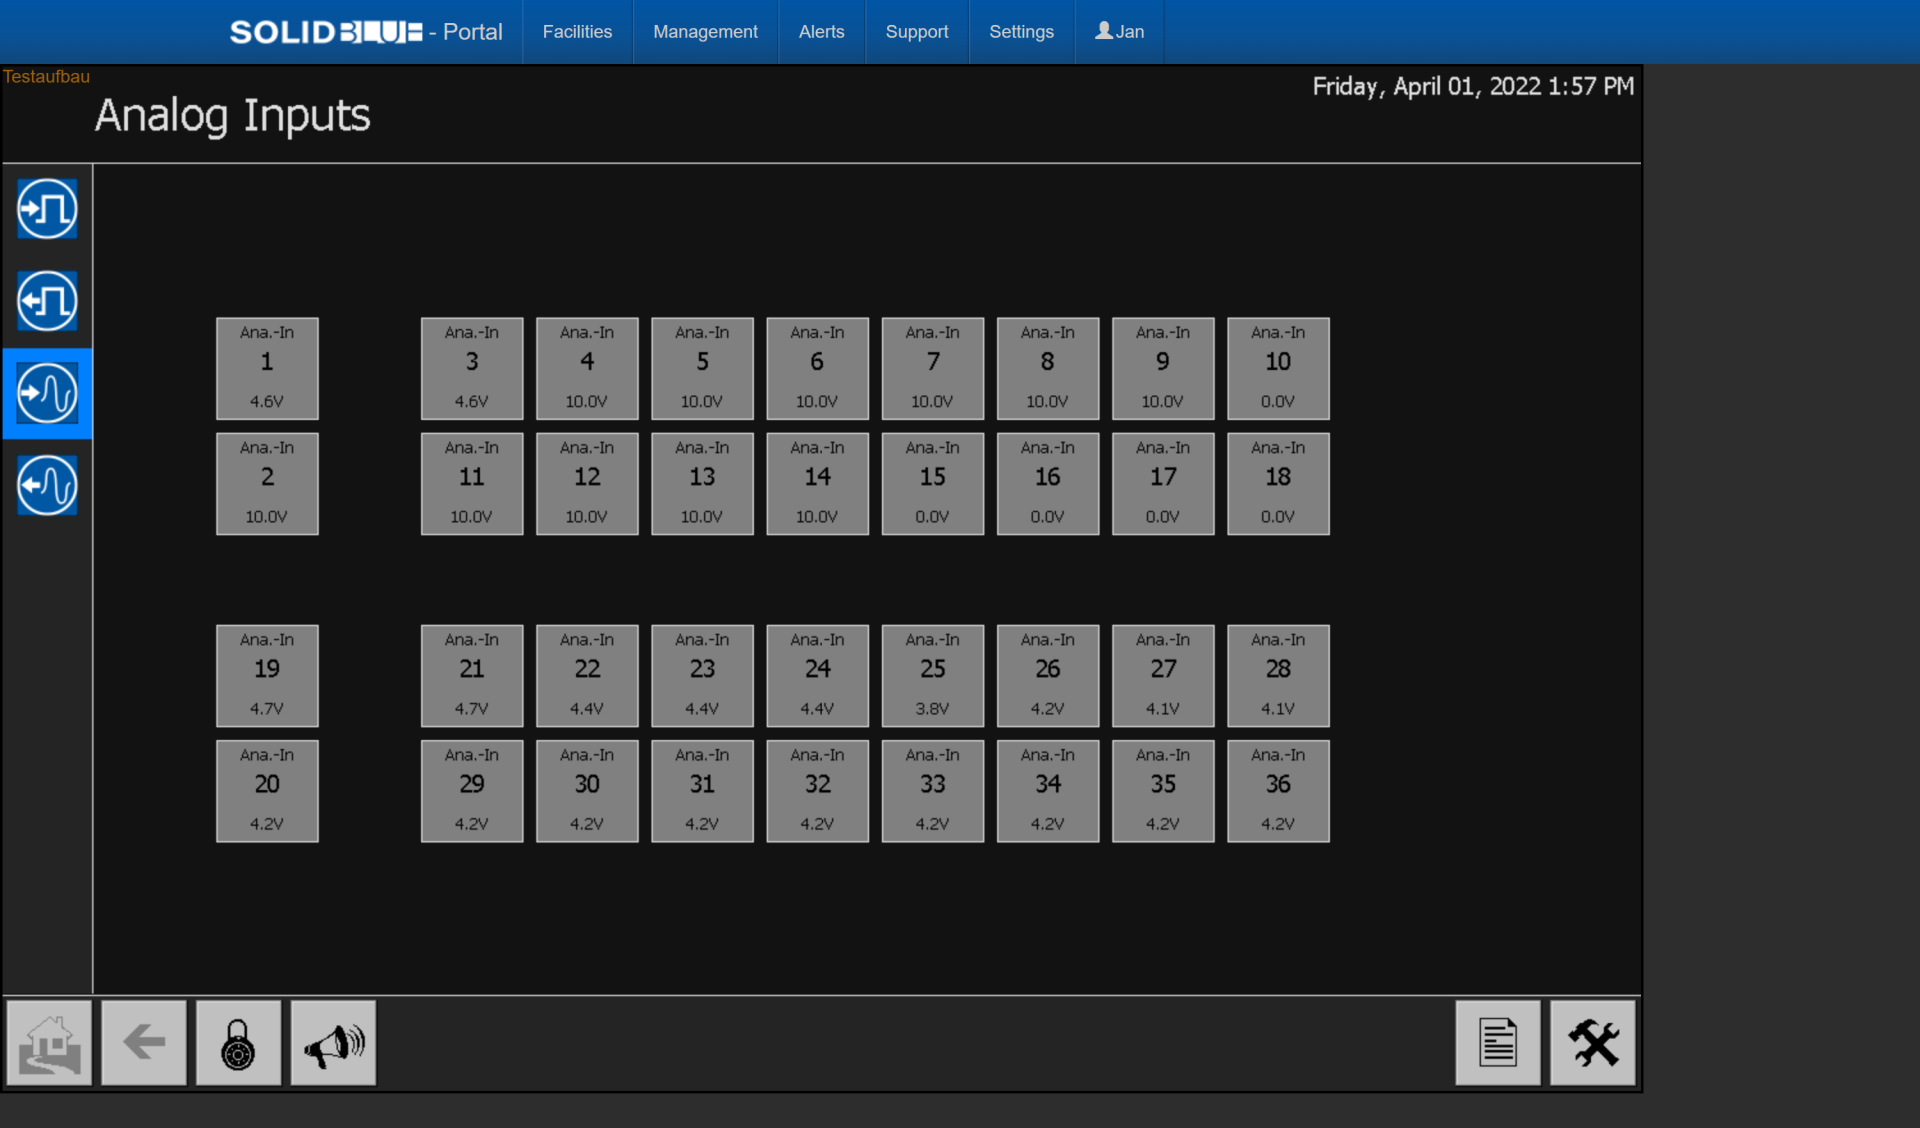
- Online access: You can access your device directly and without further programming. Even remote access to the displayed screen is possible.
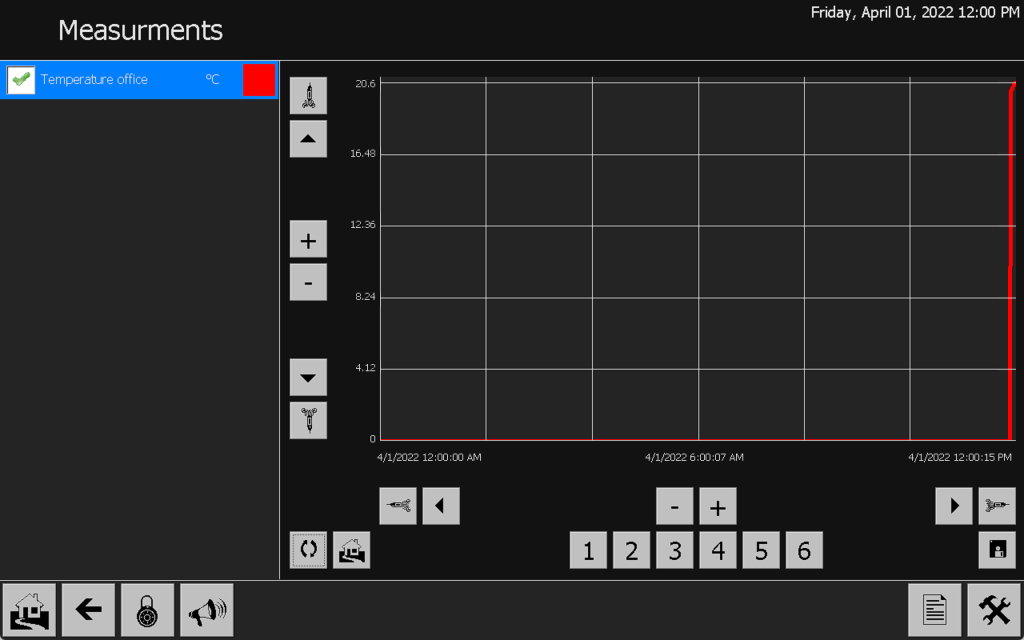
- Measurements: The measurement I create is automatically received by SolidBlue and stored in my database on SolidBlue. This means that trend recording is also possible directly. In contrast to the device on site, with SolidBlue the measured values are kept in stock for three years as standard.
- Monitoring: My room temperature can be monitored using the measurement monitoring function. If a limit is exceeded or not reached, SolidBlue informs me either by e-mail or push message.
Conclusion
At this point I would like to emphasize again that we are actually talking about an I/O device when we use the MELARECON IO. This example shows how measured values can be recorded with the device. Furthermore, the device can be connected to SolidBlue, which opens up new possibilities for monitoring, such as trend evaluation and monitoring of measured values. MELARECON also has integrated counters. These can be used as pulse or operating hour counters. These can also be evaluated directly on the device as well as on SolidBlue.
In the next post in this series I will show how to create your own visualization on SolidBlue.