

MELARECON: Measured values – logging and display
Logging
The measurements are stored locally and on SolidBlue. Depending on the setting, the measured values are stored locally on the MELARECON for a certain period of time and can be used for smaller evaluations. In addition, the measured values are also transferred to SolidBlue and permanently saved. More detailed evaluations can be made on SolidBlue.
Settings / Interface
First of all, MELARECON offers the possibility to create a flexible number of measured values with different intervals. The settings for the measured values are maintained in an Excel interface and can be individually adjusted here for each measured value. The measured values can be easily adjusted to a new project. This procedure also makes it possible to add or remove measured values during operation without great effort.
There are also a few other setting options, some of which are explained below. To log the readings, there are two intervals in the interface. The first interval is the actual logging interval. An interval in milliseconds can be specified here for each measured value, in which changes to the measured value are to be logged. The second interval (change interval) can be used to reduce the amount of data. This interval specifies the period of time when a value is saved even if there is no change in value. Example: logging interval 10 seconds and change interval 5 minutes. The measured value is only logged if there is a change in value compared to the last value. Then both intervals are reset. If there is no change, the value is not logged. If the change interval has expired and there was no change in value, then the current value is logged for security. For example, if there was a change after 4 minutes, two values are logged at this point (previous value + current time – 10 seconds and current value + current time). If the change interval is not used or is smaller than the logging interval, then each value is saved after the logging interval has expired.
In order to further contain the flood of data from the measured values and to increase effectiveness, there is the option of setting a hold time in the interface. Here you can specify in days how long the measured values are to be kept locally on the MELARECON. Older measured values are deleted in order to free up the storage space again, as local storage space is limited. The data is backed up “unlimited” on SolidBlue.
Other setting options are e.g. places after the decimal point, designation of the measured value, translation, unit or grouping.
Presentation
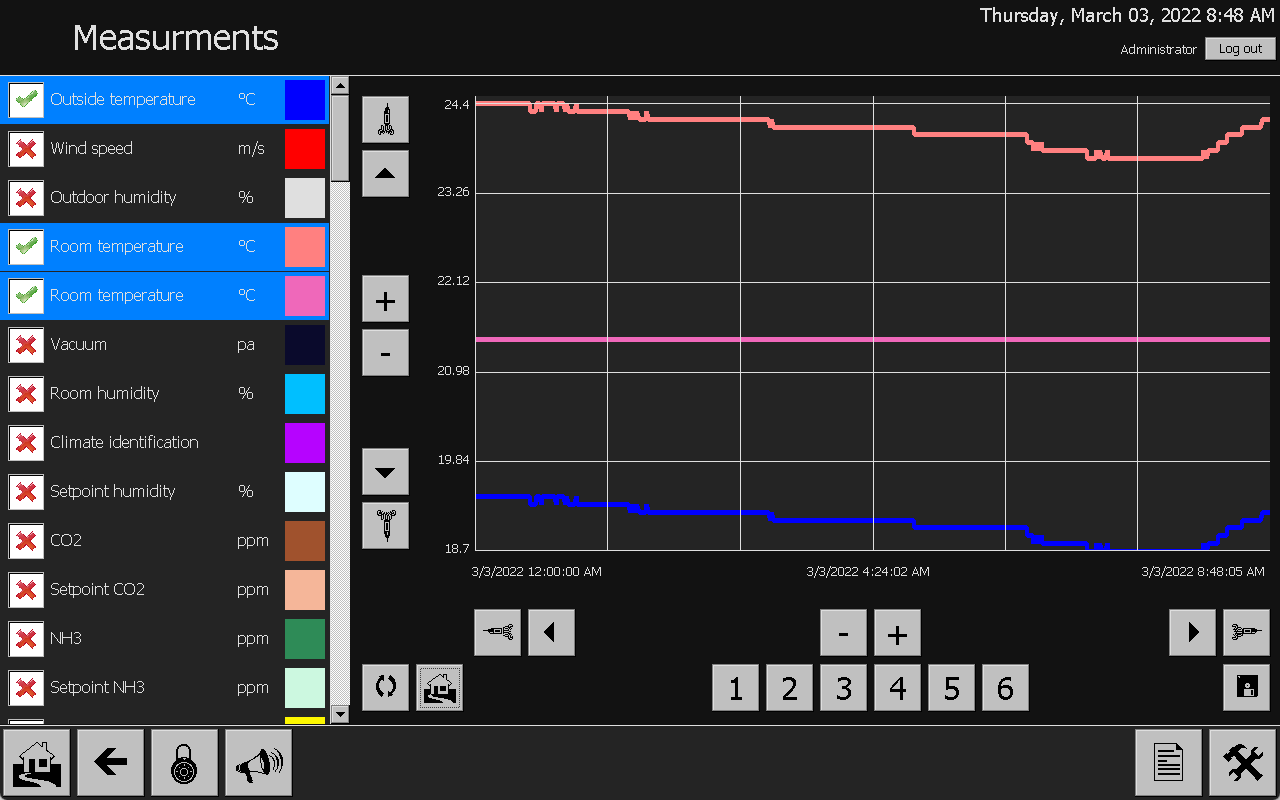
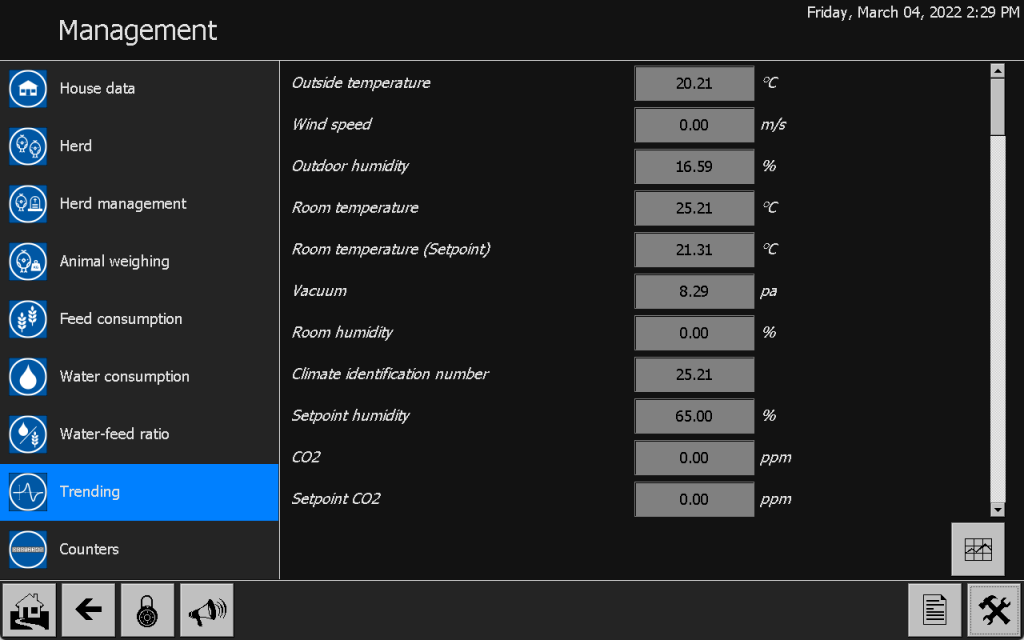
You can access the measured values on the MELARECON under “Management”. Here you can see the trend recordings. The current values of the individual measured values are displayed.
Clicking on the graphic button at the bottom right of the window takes you to the graphic display of the measured values.
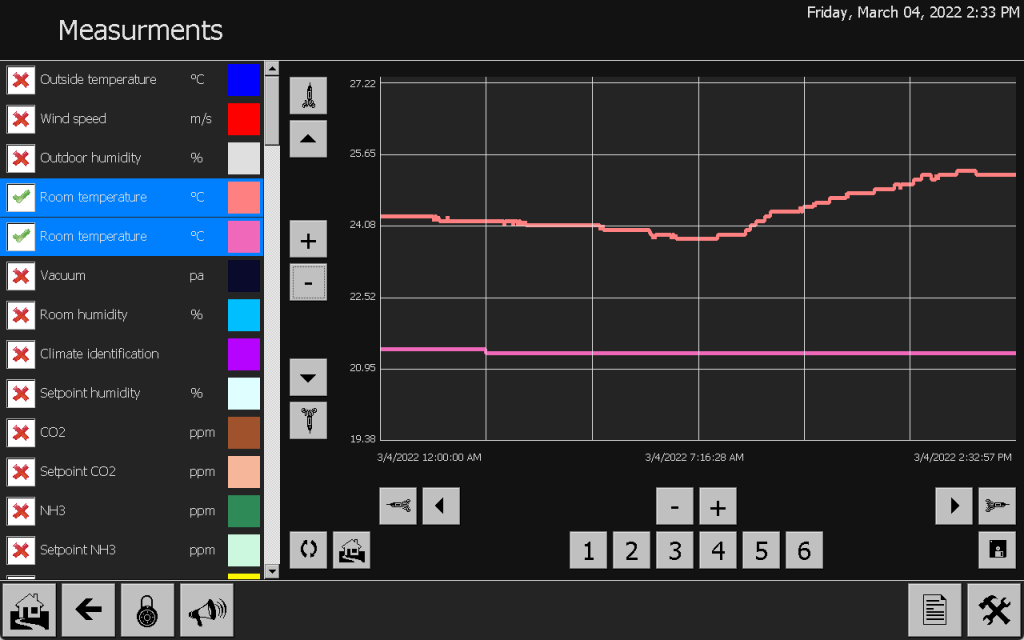
Here the customer can display the curves for the individual measured values. The desired measured values can be selected in the menu. The color of the measured value can also be changed here again, so that the customer can select the colors himself. In the window with the graph, the customer has the option of saving six different pre-selections of measured values (here the analog inputs 4-7 are saved under 1). With the button “Refresh” the graph can be updated and with “Home” the selected period is reset to 0 o’clock until now (both bottom left). The arrows and rockets can be used to move along the x-axis (time) and y-axis (value). With the arrow this happens in small steps and with the rocket the steps are larger. The plus and minus buttons on both axes are used to zoom in or out on the respective area.
The customer has the opportunity to view current developments here and can react quickly if necessary. For more precise evaluations, the measured values are available again on SolidBlue. Here the customer then has more and more detailed options to carry out evaluations.