
SolidBlue: Measured values – logging and display

In the SolidBlue portal it is possible to evaluate the received measured values graphically. To do this, the user switches to the “Measurements” dialog.
Logging
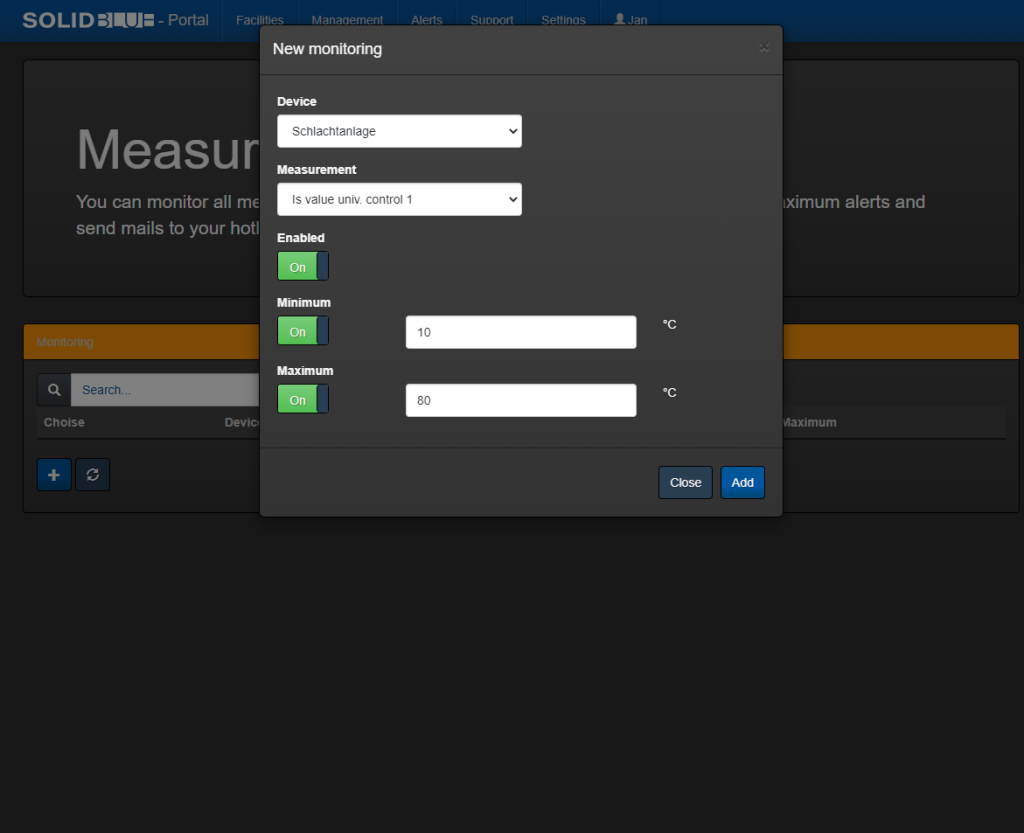
On SolidBlue, all measured values transmitted from a MELARECON are permanently stored in a customer database. The values are transferred from the MELARECON to SolidBlue via MQTT. The received measured value data can also be monitored by setting limit values. This creates an additional and independent monitoring of measured values. The user can define the limit values in the Measured value monitoring dialog.
Presentation
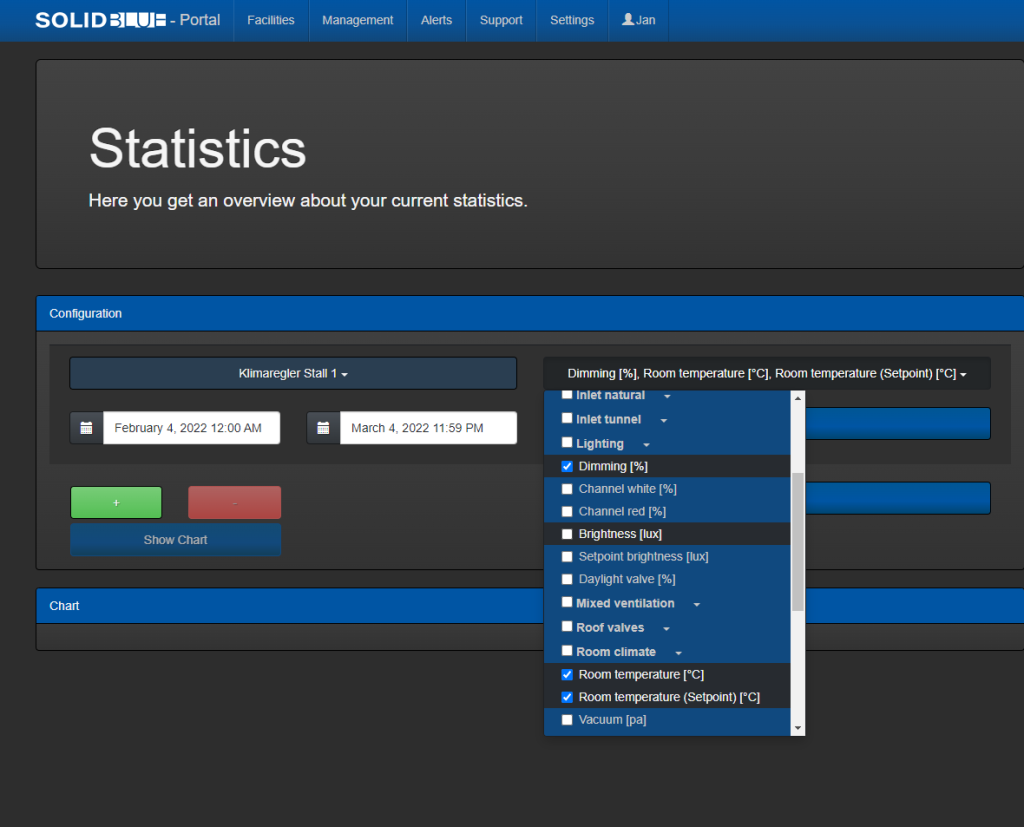
In the “Measurements” dialog, the user can select the desired measured values of all his MELARECON devices that he would like to view. He can compare readings from different devices. But what is particularly noteworthy is the possibility of comparing measured values over different periods of time in a graph. This means that you can, for example, superimpose the curves for the months of July and June for one measured value. In this case, the displayed chart has two time axes. Of course, it is then also possible to compare several values from different devices and periods.
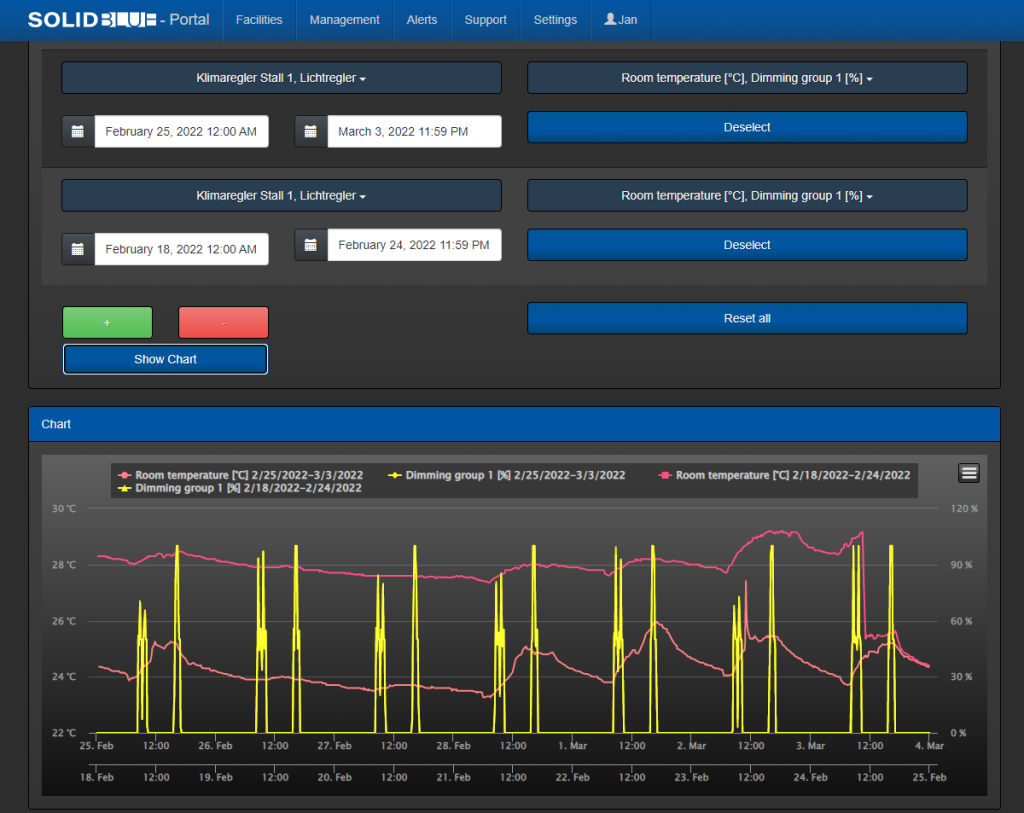
The displayed chart offers a zoom function. This can be done either by holding down the right mouse button or by using appropriate touch gestures. This allows specific dates and time periods to be viewed more quickly and easily.
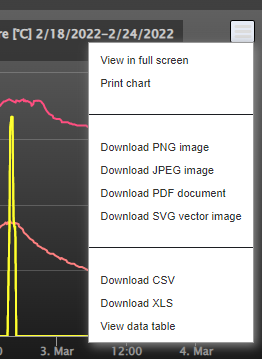
The selected measured values and graphs can also be exported in different file formats. These formats would be XLS, CSV, PDF, PNG, JPEG and SVG. A print function and a table view are available here as additional options.