Tag: Visualization

After the remodel

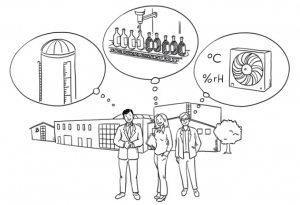
MELARECON is used in industry

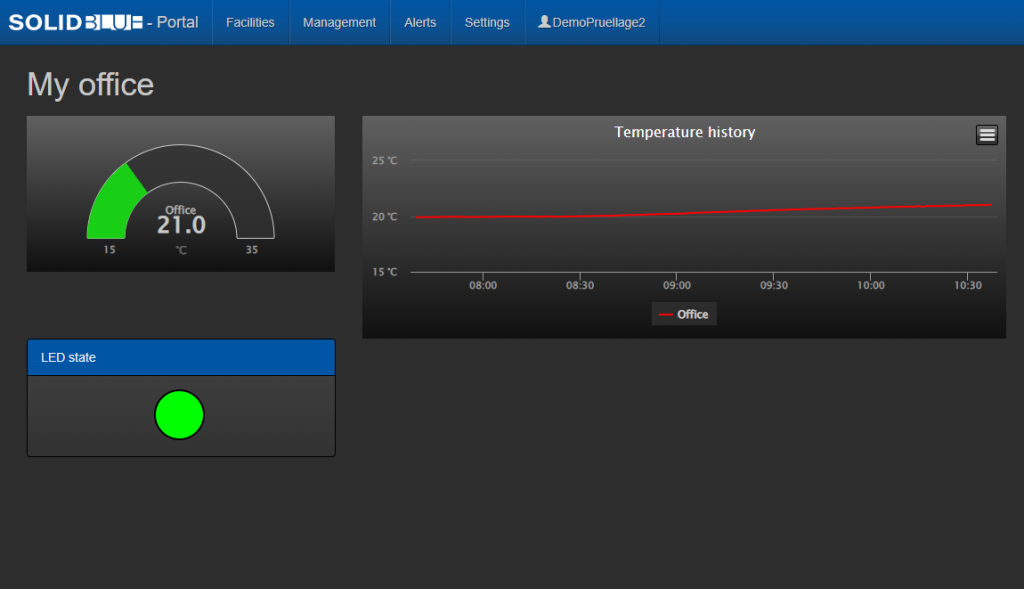
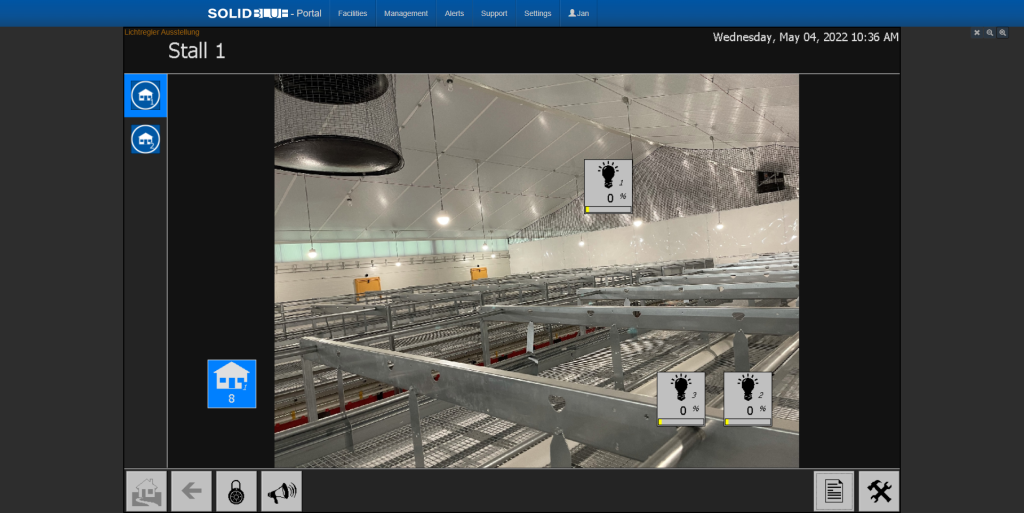
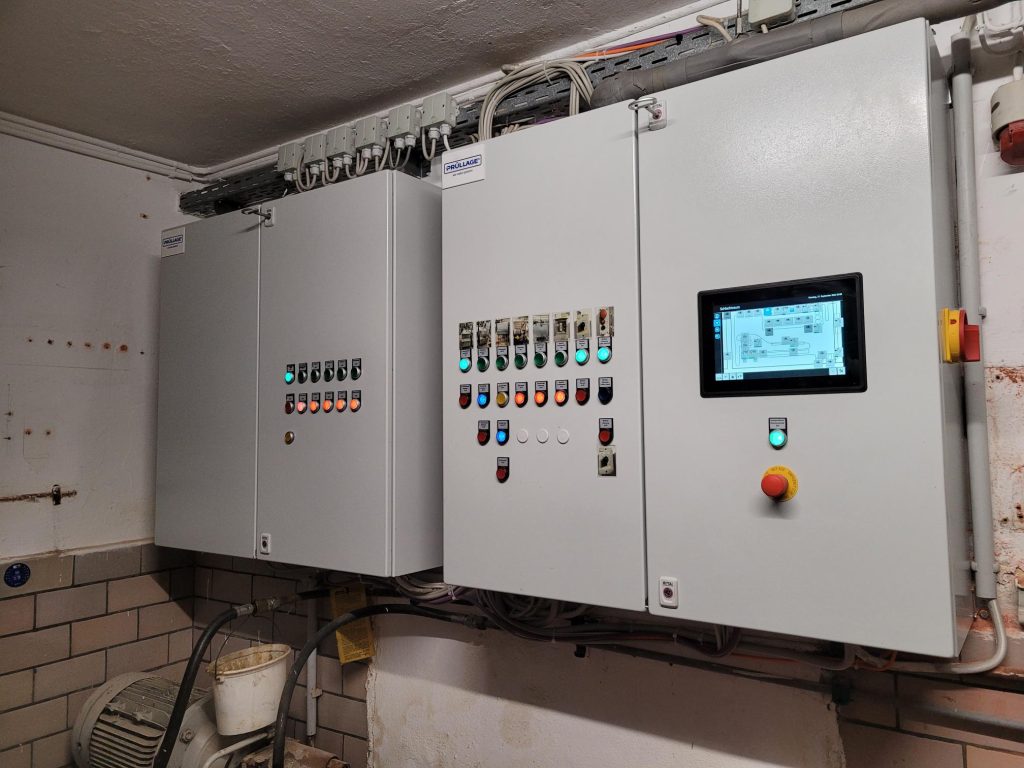
We report on the successful implementation of a monitoring project using our MELARECON and the SolidBlue platform. In addition, the controller takes on control tasks and uses CANopen as a bus system to connect a wide variety of sub-distributions. By using schedulers and production templates, the system can now automatically make the appropriate preparations for the successful start of production.

Dashboard of my office

From practice: Create process pictures

In this post, I would like to work with you to complete the dashboard from the previous post in this series. I will show you how to create process images and integrate them into our already created dashboard page.

MELARECON loves S7 protocol

Integration of S7 communication

New application scenarios are made possible by implementing the S7 protocol. Target and actual values can now also be exchanged with a SCADA system or HMI device. The data provided on the S7 side can be configured via an interface.

Dashboard of my office

From practice: Display of process data

In this post I will show you how to create a visualization on SolidBlue. I use my test setup from the previous posts in this series.

New screen mirroring

Screen mirroring optimization

SolidBlue makes it possible to view and operate the screen of connected MELARECON devices live. Above all, this supports the service staff in helping the customer on site. In SolidBlue’s latest update, screen mirroring has been revamped with new features.