

From practice: Display of process data
Hello and welcome to the “From practice” series. Today I want to show you how to create your own visualization on SolidBlue. In this article, I will show you with a concrete example how you can proceed. For this I use the test setup with the intelligent I/O module MELARECON IO, which is already known from the previous articles in this series. This makes it possible to implement the example with every MELARECON and you have the opportunity to participate.
Project goal
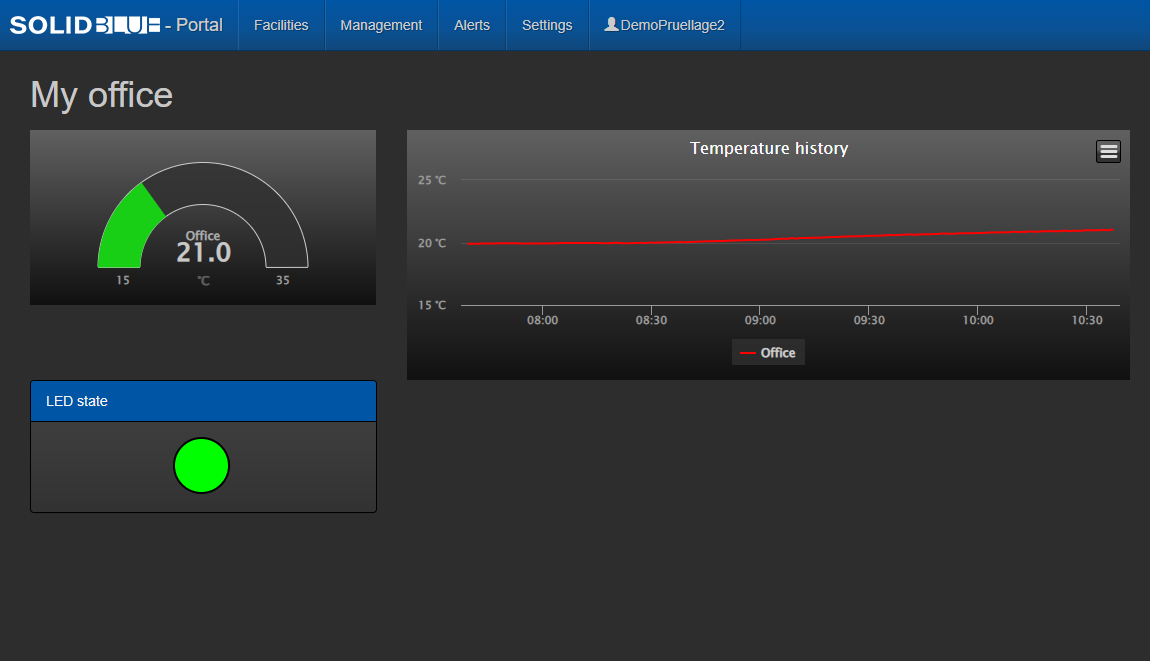
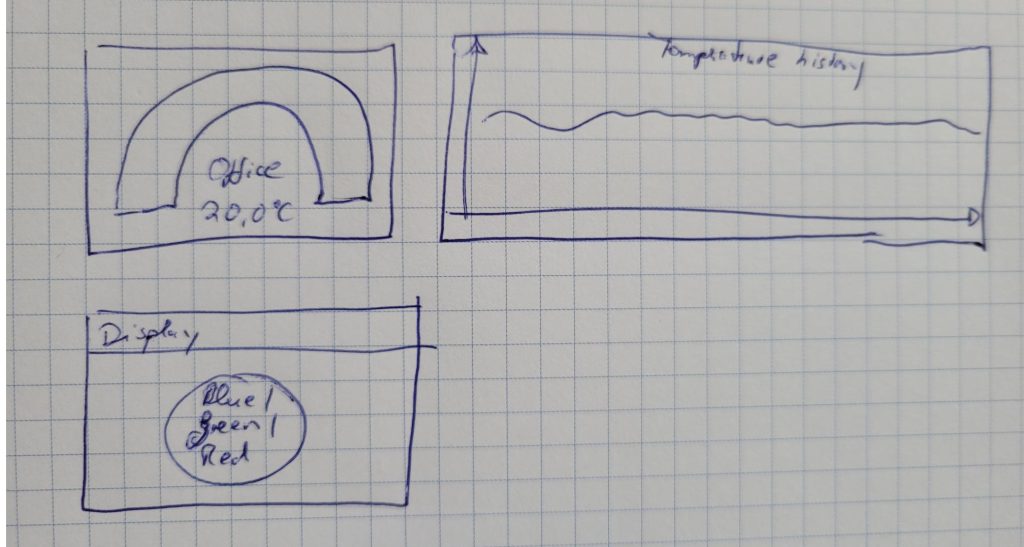
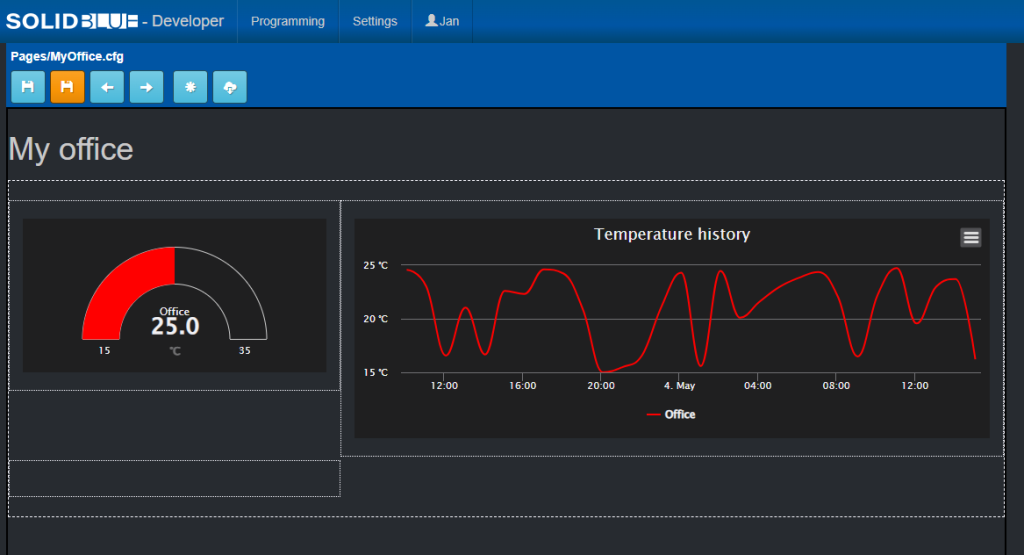
The aim of this project is to create a small dashboard that shows the current temperature in my office, a temperature curve and the currently displayed LED state. I made a little mockup for it.
Create project
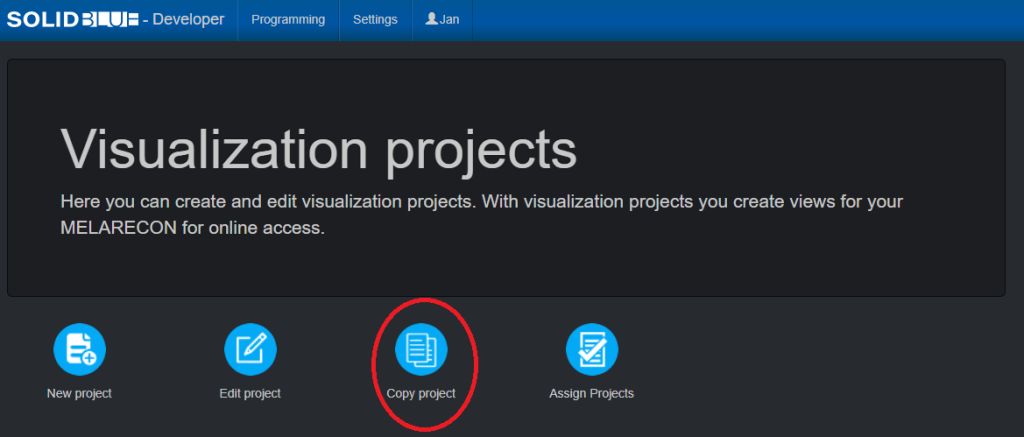
Now I log into the SolidBlue developer portal and switch to the Visualization projects dialog. Here I select the Copy project function to create a copy of the existing project for the MELARECON IO.
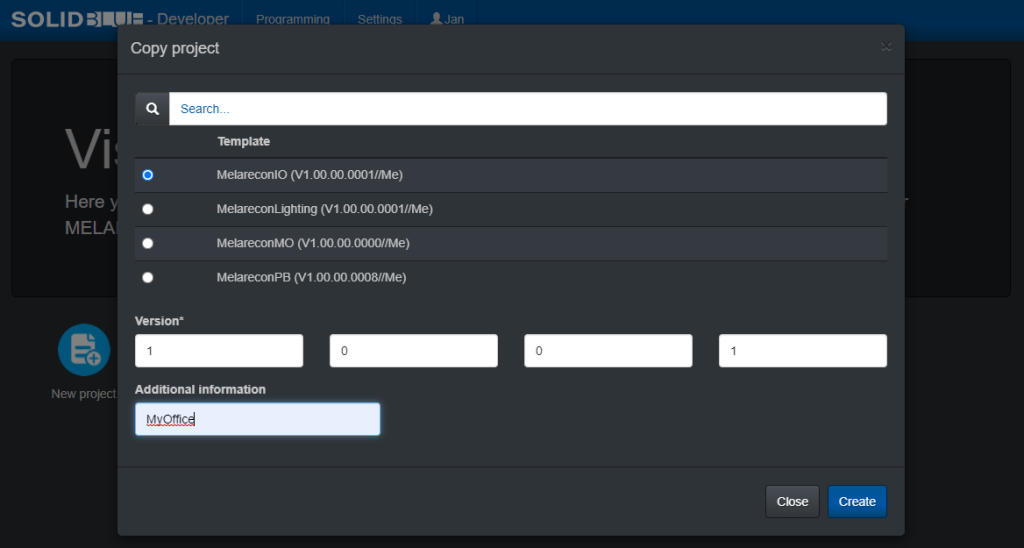
I choose the existing “MelareconIO” project as a template and enter additional information so that I can later distinguish the project from the original project.
The newly created project is opened directly and I am in the menu of the tree view.
Creation of the view
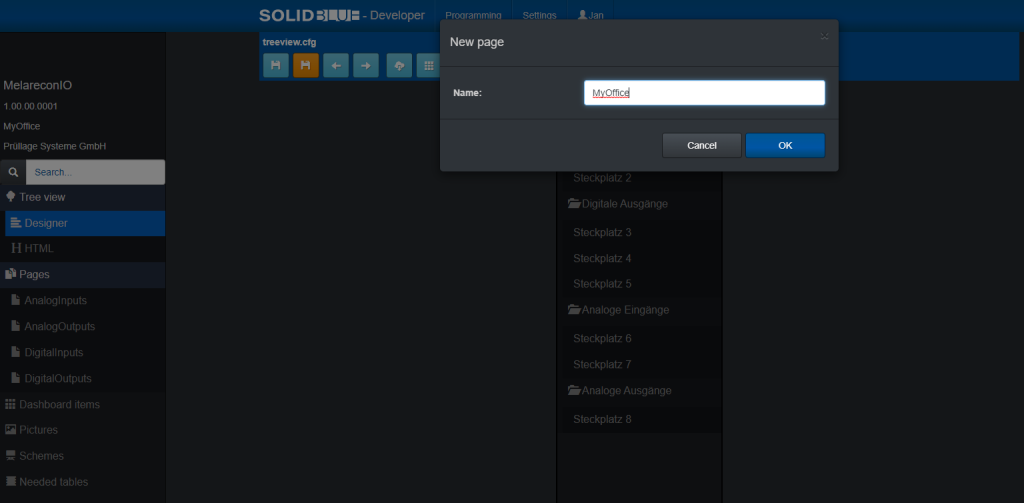
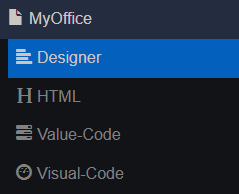
I want to create a new page now. I can do this by right-clicking on “Pages” in the menu on the left. In the context menu that appears, I select the “New” option. You will now be prompted to enter a name for the page. I choose the name “MyOffice”.
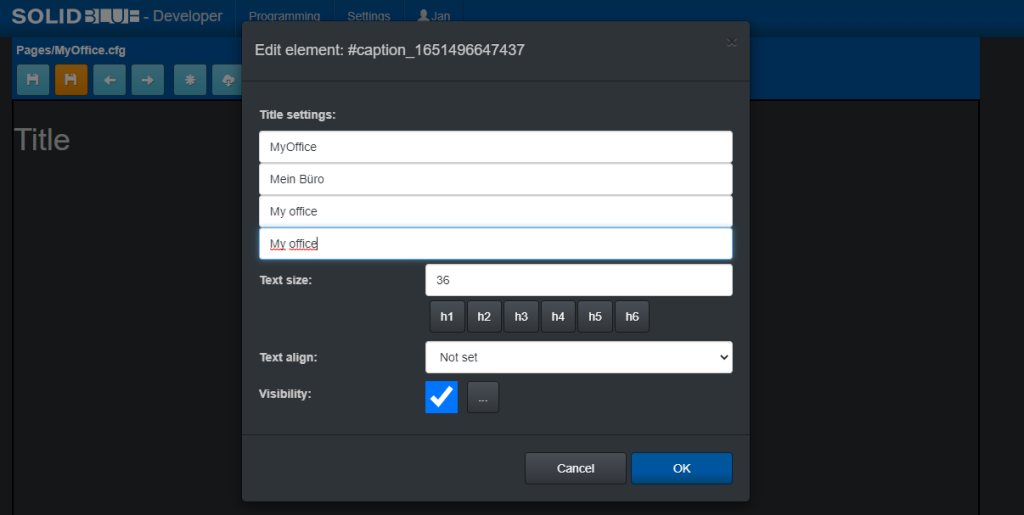
Now open the designer of the newly created page. You will now see an empty page. If you now right-click on the blank page, you can use the context menu that appears to insert new objects. Now add a new “caption” object. This can be found under the “Design elements” tab. As a title I enter several things:
- Key: “MyOffice”
- Translation 1: “Mein Büro” –> This is the German translation
- Translation 2: “My office” –> This is usually an English translation
- Translation 3: “My office” –> A third language can be maintained here.
We’ve now added a headline. In the next step I add another “row” object. This can be done again by right-clicking on the page and the corresponding context menu. Once you have created the “row” object, you can insert further objects into this object. To do this, use the context menu of the “row” object and select “Add”. I want to insert a “col” object into the “row” object. These are the properties of a “col” object:
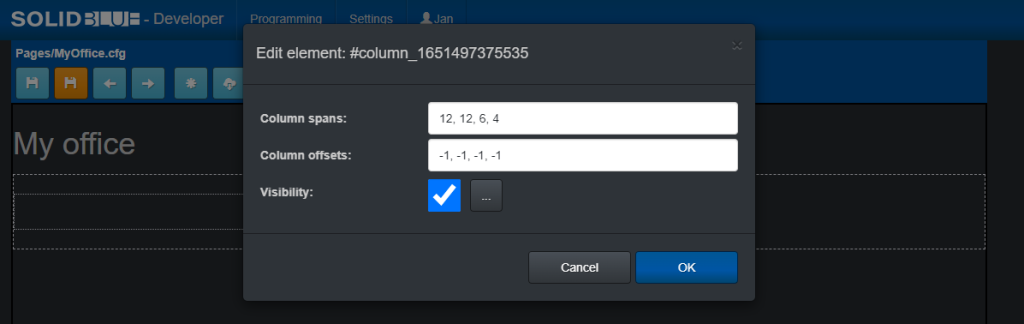
- Column spans: The positioning of “col” objects (columns) is based on the Bootstrap framework. There are always up to 12 columns per row. You can enter up to four numbers separated by a comma. The first number stands for the number of columns which are to use for the content if a small display is available (e.g. smartphone). The following numbers are intended for the next display sizes up to the full HD resolution of a desktop screen.
- Column offsets: As with the column width, the column offset can also be changed depending on the four display sizes. Entering -1 means that no offset should be used.
- Visibility: Here you can decide whether the object should be displayed or not. Using the button to the right, rules can be set as to when the object should be visible or not visible.
I now add two more “col” objects to the “row” object. In the first column, however, I change the last number from 4 to 8. As a result, this object no longer uses 4 columns on a large display, but 8 and it appears much larger. Add these columns as well and then simply change the size of the window and observe the behavior of the columns.
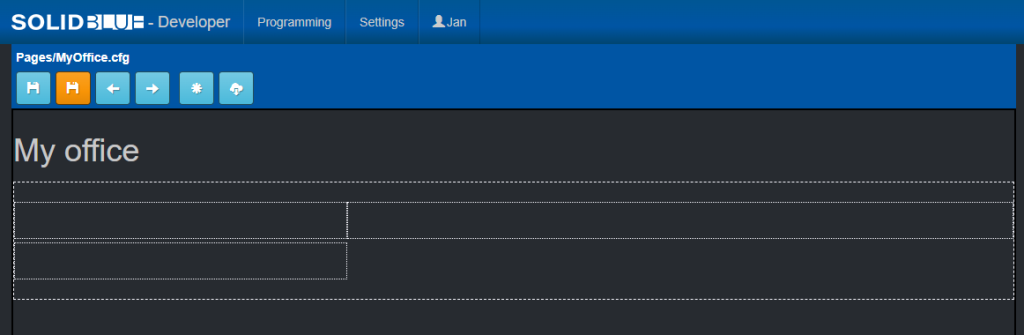
The result is that we have now created a layout that resembles our mockup shown above. The temperature display should later be in the first column, a trend in the second column and the LED state should be in the last column.
Create variables
The layout is set. But now we need variables that can provide us with the information we need for the other objects. To do this, click on the small cloud symbol in the menu bar above. A dialog appears in which you now select “Add”. There are currently three variable types that you can use.
- melarecon-control-value: These are values that are read by a MELARECON device.
- sql-measurement-value: These are queries from the measurement table.
- sql-counter-value: This variable type provides queries from the counter table.
What do we actually need? We need the current temperature, which we can query via an analogue input. We also need the states of the three digital outputs for the LED state. Finally we need the temperature trend from the measurement table. In summary, we need two melarecon-control-values and one sql-measurement-value. Now let’s create the individual variables. Select “melarecon-control-value”. The following dialog is displayed:
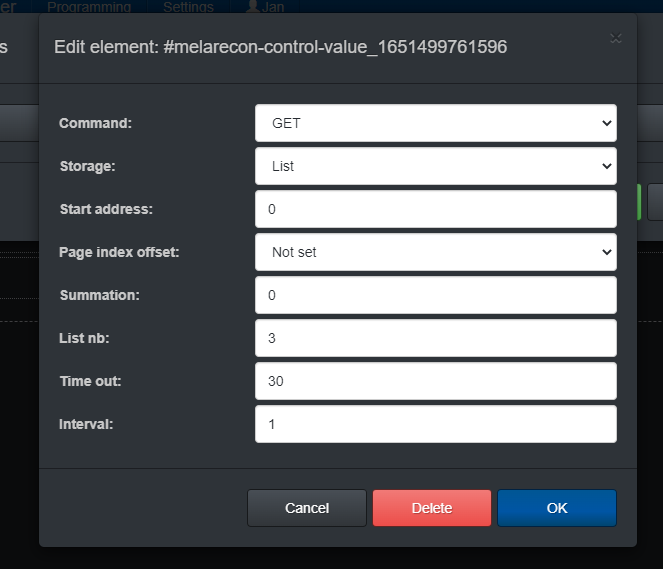
- Command: There are three choices. GET only reads a single value. GETLIST requests an entire memory list from the MELARECON. And GETARRAY only requests parts of a memory list.
- Storage: Here you can determine from which memory to read.
- Start address: Start address if only a single value is to be queried or only parts of a memory list.
- Page index offset: Queries can be made dynamic. We don’t need this here.
- Summation: In the case of dynamic queries, the start address can also be changed. We don’t need this here either.
- List nb/Can bus device address: If the LIST type or the memory of a CAN bus device is selected as the memory, the corresponding entry can be made here.
- Count of values: If you have selected LISTARRAY as the type, you can set the number of values here.
- Time out: Set here how long the MELARECON should make the requests available. If no new request is made to the MELARECON within the time set here, it will stop publishing its values.
- Interval: Enter the speed at which the MELARECON should publish its values.
| Command | GET | GETARRAY |
| Storage | Local analog input (PT1000) | Local digital output |
| Start address | 2 | 0 |
| List nb / Can bus device address | – | – |
| Count of values | – | 3 |
| Time out | 30 | 30 |
| Interval | 1 | 1 |
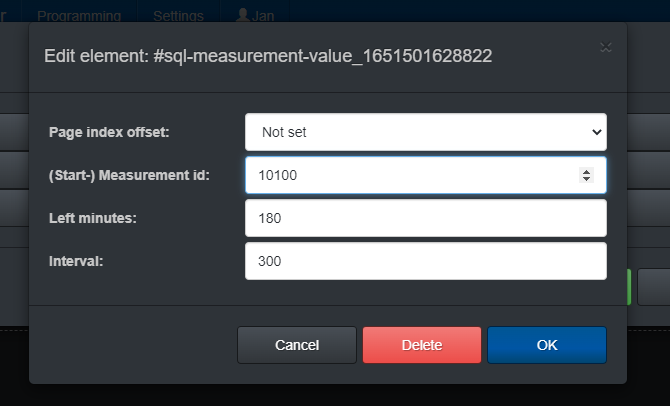
Finally, let’s create a query to get the temperature trend. For this you need a variable of the type sql-measurement-value. This provides the following properties:
- Page index offset: Queries can be made dynamic. We don’t need this here.
- (Start-) Measurement id: Id of the measured value. In our example we chose 10100.
- Left minutes: Here you can set how many minutes should be displayed.
- Interval: Enter the number of seconds after which the query should be repeated.
Temperature display
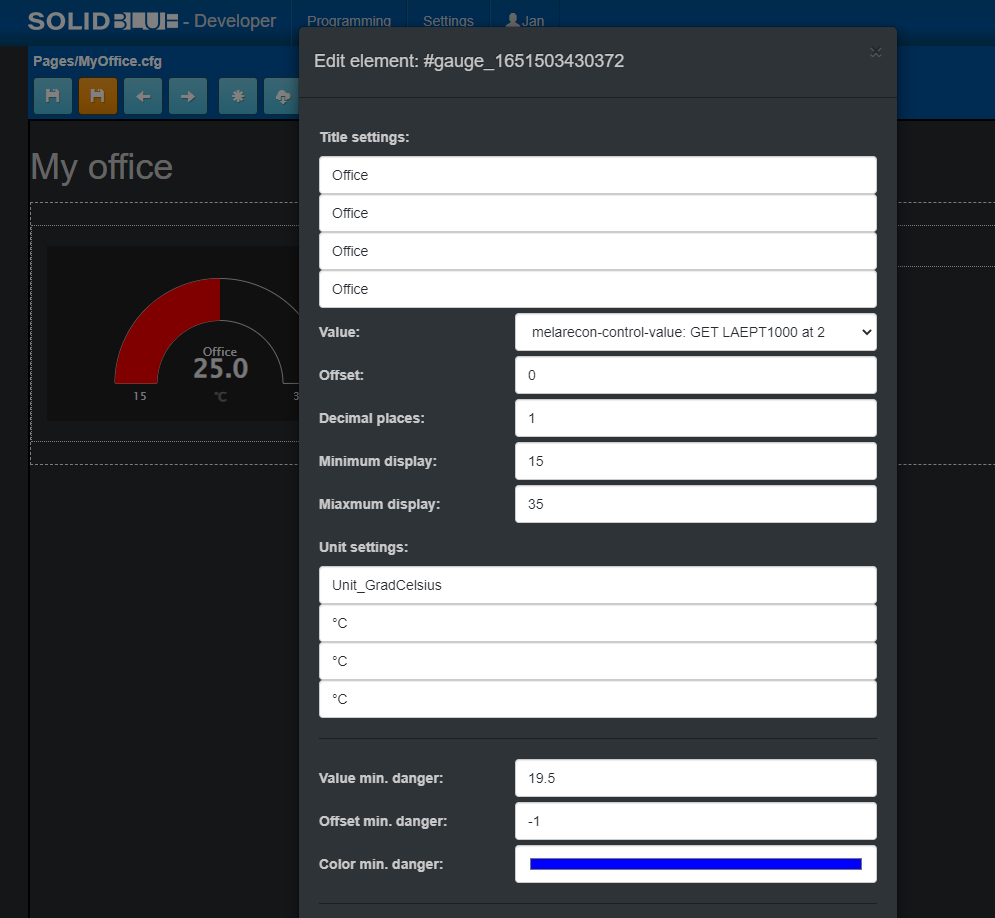
Back to our design. In the first column (“col” object) we add a “gauge” object via the context menu. This object can be found in the others tab. This object also offers a wide variety of settings:
- Title settings: A translation key and three translations can be entered here again.
- Value: Select the first melarecon control value here.
- Offset: The previously selected value consists of only one value and therefore 0 should be selected here.
- Decimal places: Here you can decide how many decimal places should be displayed. I choose one here.
- Minimum display: Here you can decide with which value the display should start. I choose 15 here.
- Maximum display: Here you can select the maximum display. Here I choose 35.
- Unit settings: Here you can make settings for using a unit.
- Value min. danger: It is possible to change the color of the displayed bar graph when the value is in the limit range. I put our 19.5 here to color the graph blue when it’s too cold. For “Value normal” I choose 21 and for “Value max. danger” I choose 22.5.
- Offset min. danger: The minimum value can also be taken from the value selected above. But this is not possible here.
- Color min. danger: Here I choose the color blue. Here, too, I choose green for “Color normal” and red for “Color max. danger”.
I leave all other settings at the default.
Temperature trend
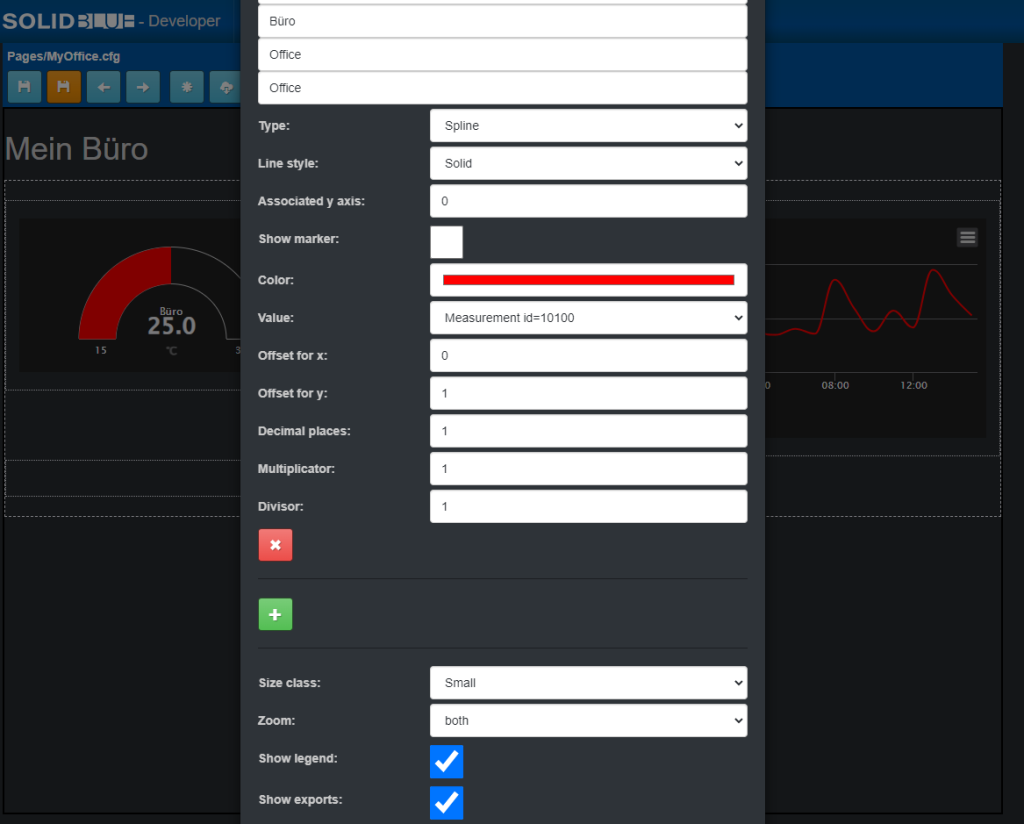
The temperature trend should now find space in the second column object. To do this, I select “Add” in the context menu of the corresponding column. In the Others tab, select the “database-chart-trend” object. In the following dialog I made the following settings:
- Title settings: The title of the chart can be determined here.
- Y axis unit: I assigned the unit °C to the Y axis.
- Auto scale: I disabled this option. This allows me to determine the minimum and maximum of the Y-axis myself.
- Minimum: I use 15°C as a minimum.
- Maximum: I entered 25°C as the maximum.
- Series name: The name of the first series to be displayed can be set here. I entered the name “Büro” with the appropriate translations.
- Type: I like to use spline as line type. With this type, the line to be displayed is somewhat rounded.
- Value: As a value, I select the corresponding measured value, which we had already created above.
- Zoom: I choose “both” here. This allows you to zoom freely in the chart.
- Show exports: By activating this option, a context menu is displayed at the top right of the chart.
- Show cross hairs x: With this option, a line is drawn in the X direction when the mouse is moved over the measured value.
- Show cross hairs y: This also draws a line in the Y direction when the mouse is moved over the chart.
- Show tooltips splited: If the mouse is moved over the chart, the displayed tooltip is shown separately.
All settings that are not listed are left at their default settings.
Save and translate
I would now like to save the previous settings. To do this, click on the yellow button at the top of the menu bar. This saves the current configuration of the created page and generates the corresponding HTML and JavaScript code.
Test intermediate state
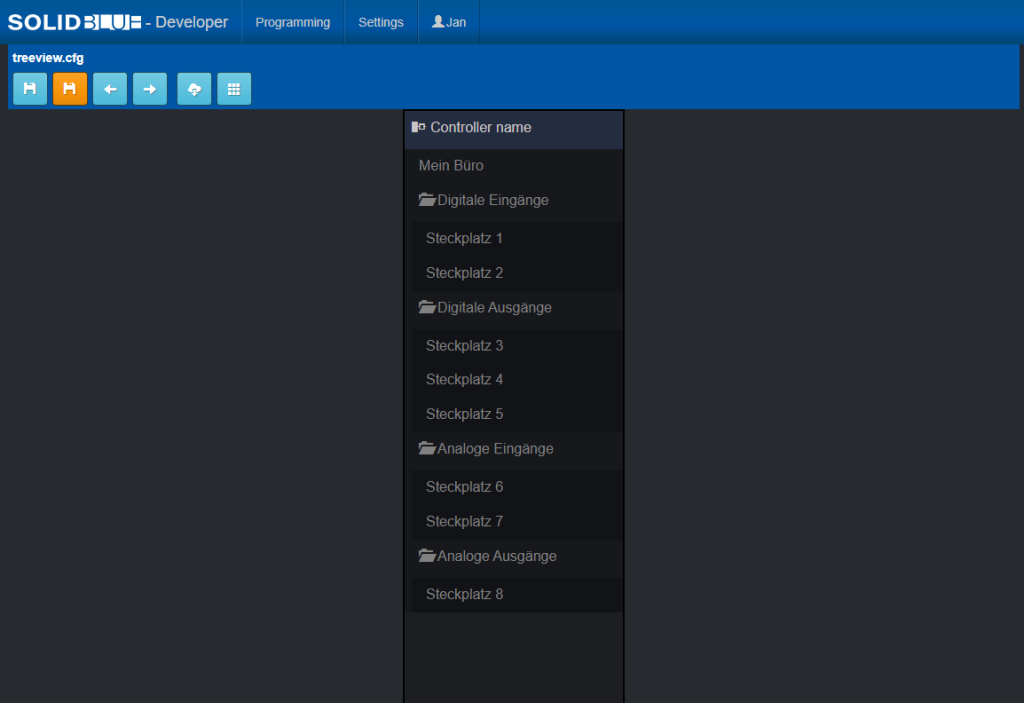
I would like to test this intermediate state now first. However, the newly created page must also be accessible via the menu. It is therefore necessary to expand the menu tree of the project accordingly. I add a new menu via the context menu of the first entry in the menu tree (“Controller name”) and enter the appropriate title settings. Furthermore, I select my newly created page under the “Page” setting. After that I select the “Reorder” option in the context menu of “Controller name” and use the keys to move the last element to the top. In the last step, save and compile the changed menu tree.
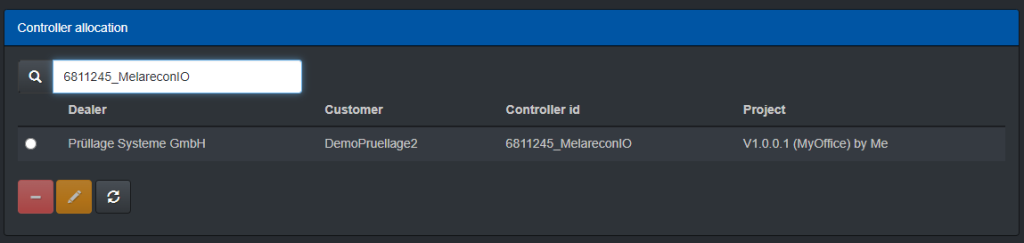
In order to test the adapted project, I have to tell the server system in the last step that it should not use the globally specified standard project, but exactly this one. You do this by exiting the project and selecting the “Assign projects” menu item in the “Visualization projects” dialog. In the “Assign projects” dialog, first look under “Controller assignments” for your own controller. In the table below you will notice that no project has been assigned. In the previous article in this series, however, we noticed that something was still being displayed in the portal. This is due to the fact that both global and dealer-dependent project assignments can be made for each controller type. So SolidBlue first checks whether there is a project assignment specifically for a controller. If this is not the case, the system checks whether an assignment has been made at dealer level. If this is also not the case, the global assignment is checked. If there is also no global assignment, the controller is not displayed at all in the portal under online access.
So now edit your controller’s project assignment and assign your customized project.
If you now open the “Online access” function in the portal or via the dealer platform, you will see the following when you call up the corresponding page in the menu tree of your device.
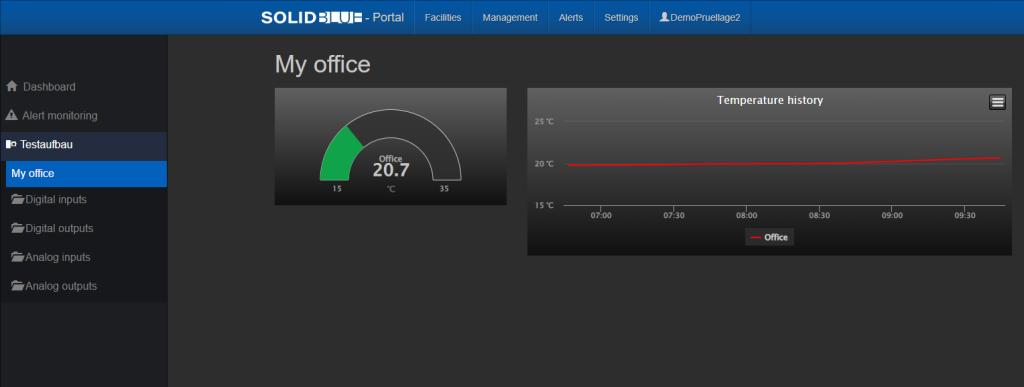
Conclusion
With simple configuration and without any programming knowledge, we visualized the process data of an I/O device and created a small dashboard. What is still missing is the LED display. I would like to do this with you in the next post.